Using this “Rblog”
At the top you should find a search box and a menu. Probably the best way to find if I have something you want here is to use that search. However, you may also find things using the “CATEGORIES” menu on the right of this main page.
Going back to the top right of the menu bar “Welcome” gives you a bit more than this introduction, “About” gives you some geeky background and you can guess what “Copyright/permissions” gives you. I hope it’s all useful, do please contact me if you have suggestions, comments, corrections or requests. What follows below is the full list of posts in reverse chronological order of creation. Code used in the posts is in them and revealed by hitting the “Show code”, buttons. Inside code blocks there is a “copy to clipboard” button if you hover your cursor inside the block.An R SAFAQ

Pseudonymisation and hashing ID values
This makes the argument for hashing ID values in open data

League tables
Illustrating the need to be wary of league tables
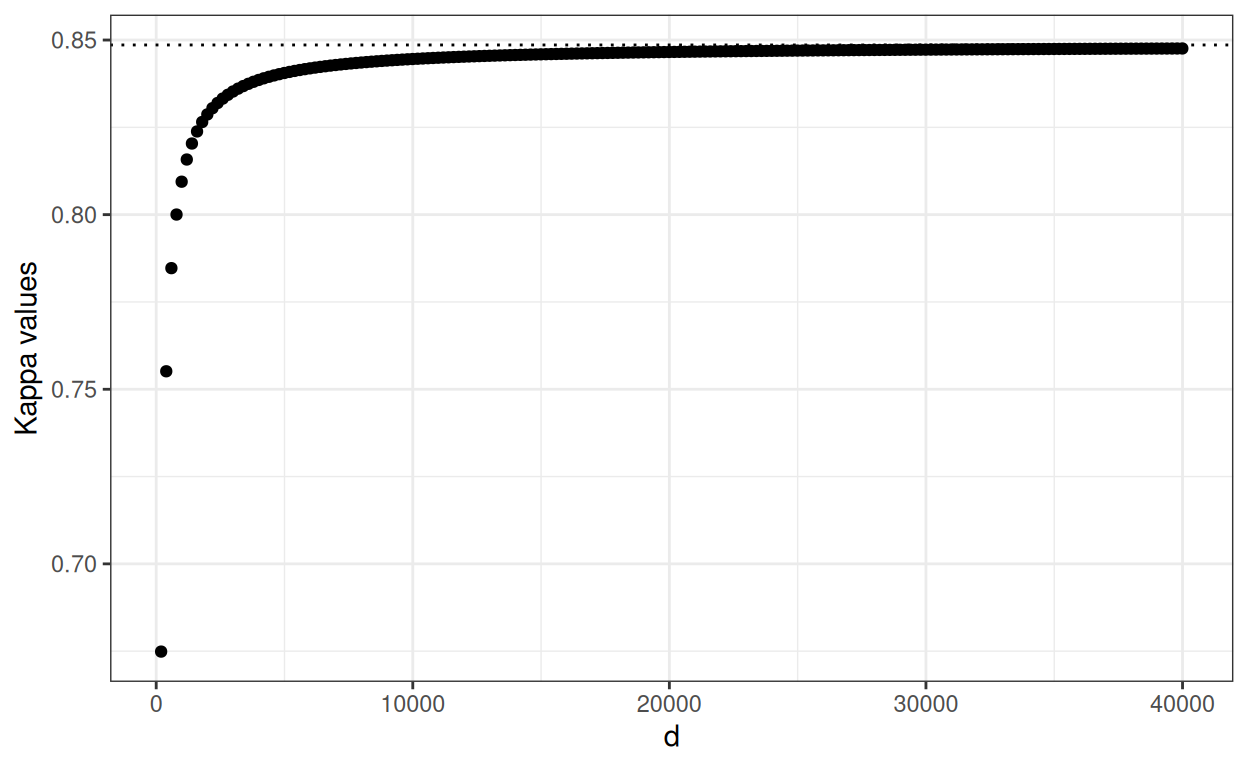
F-measure: 'positive specific agreement' index
Illustrates that the Cohen's kappa converges on the F-measure as d increases

Mapping dates to episodes
Illustrates how to use join_by() in tidyverse R to do this.
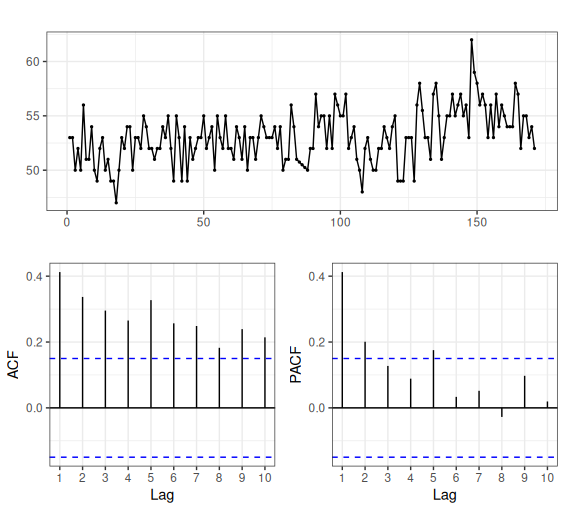
Autocorrelation (1)
Reminding myself about autocorrelation methods.
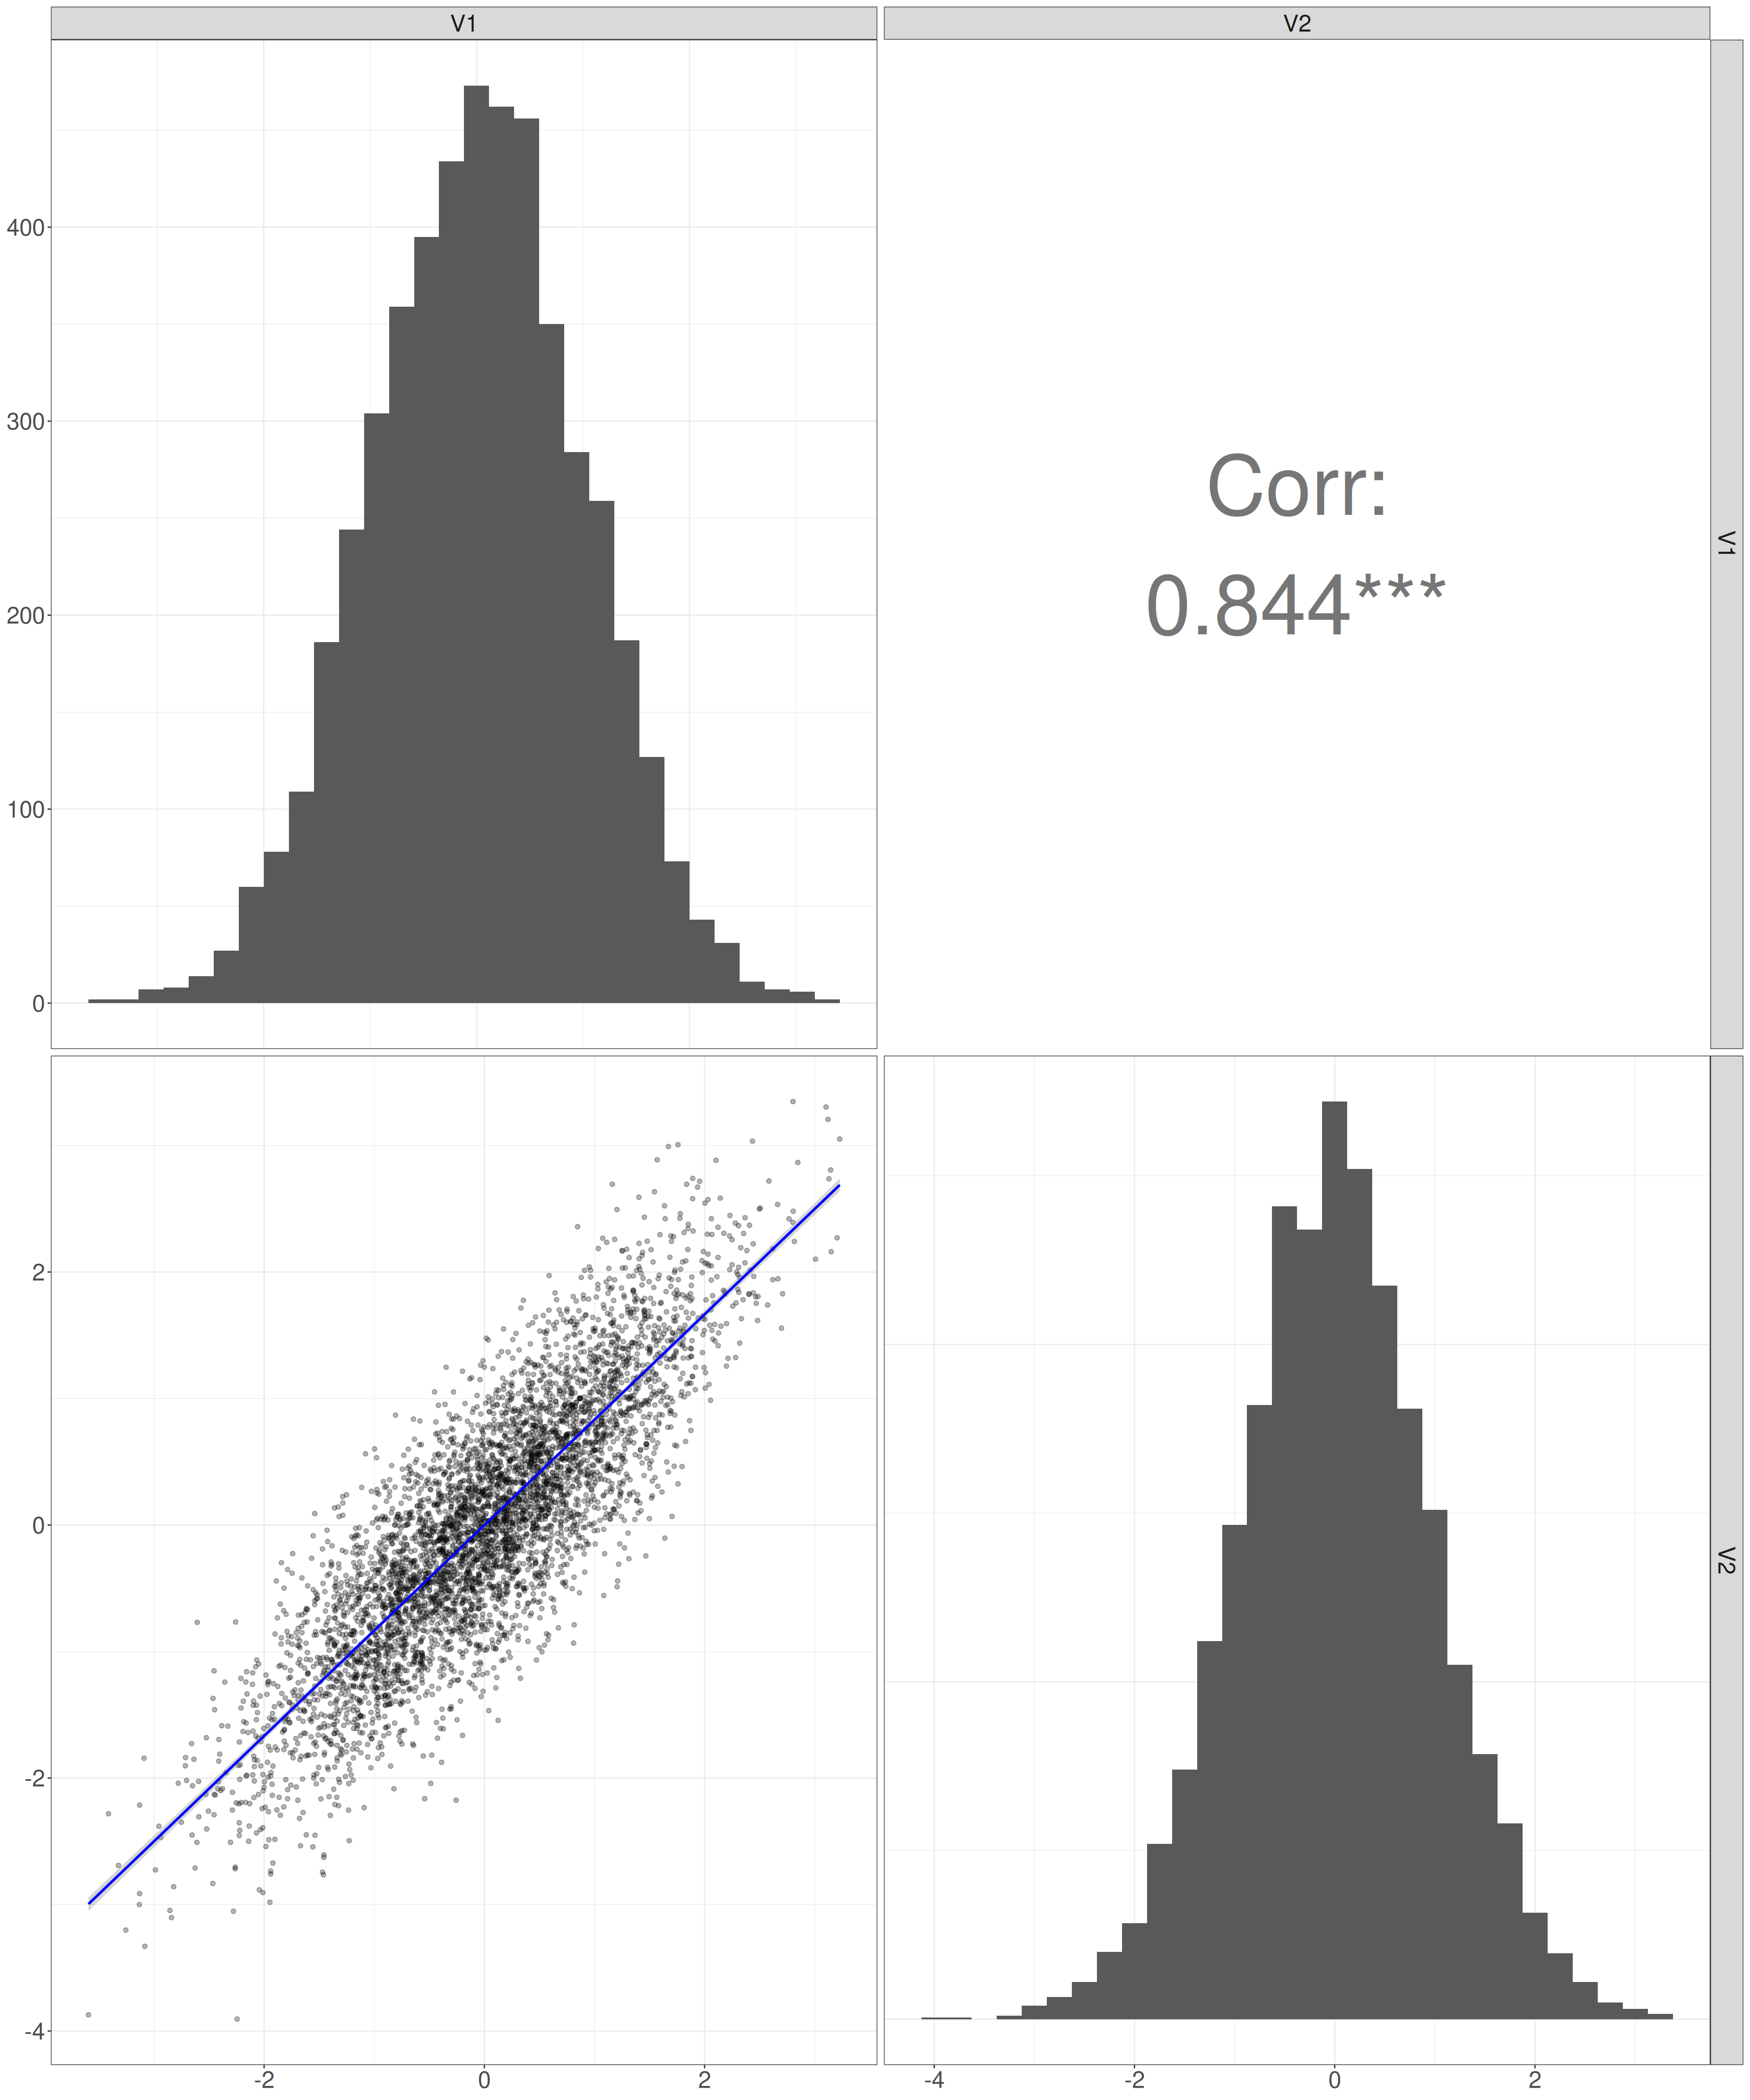
Dichotomisation (1)
Illustrates the impact of dichotomising a continuous variable on correlations with other variables.
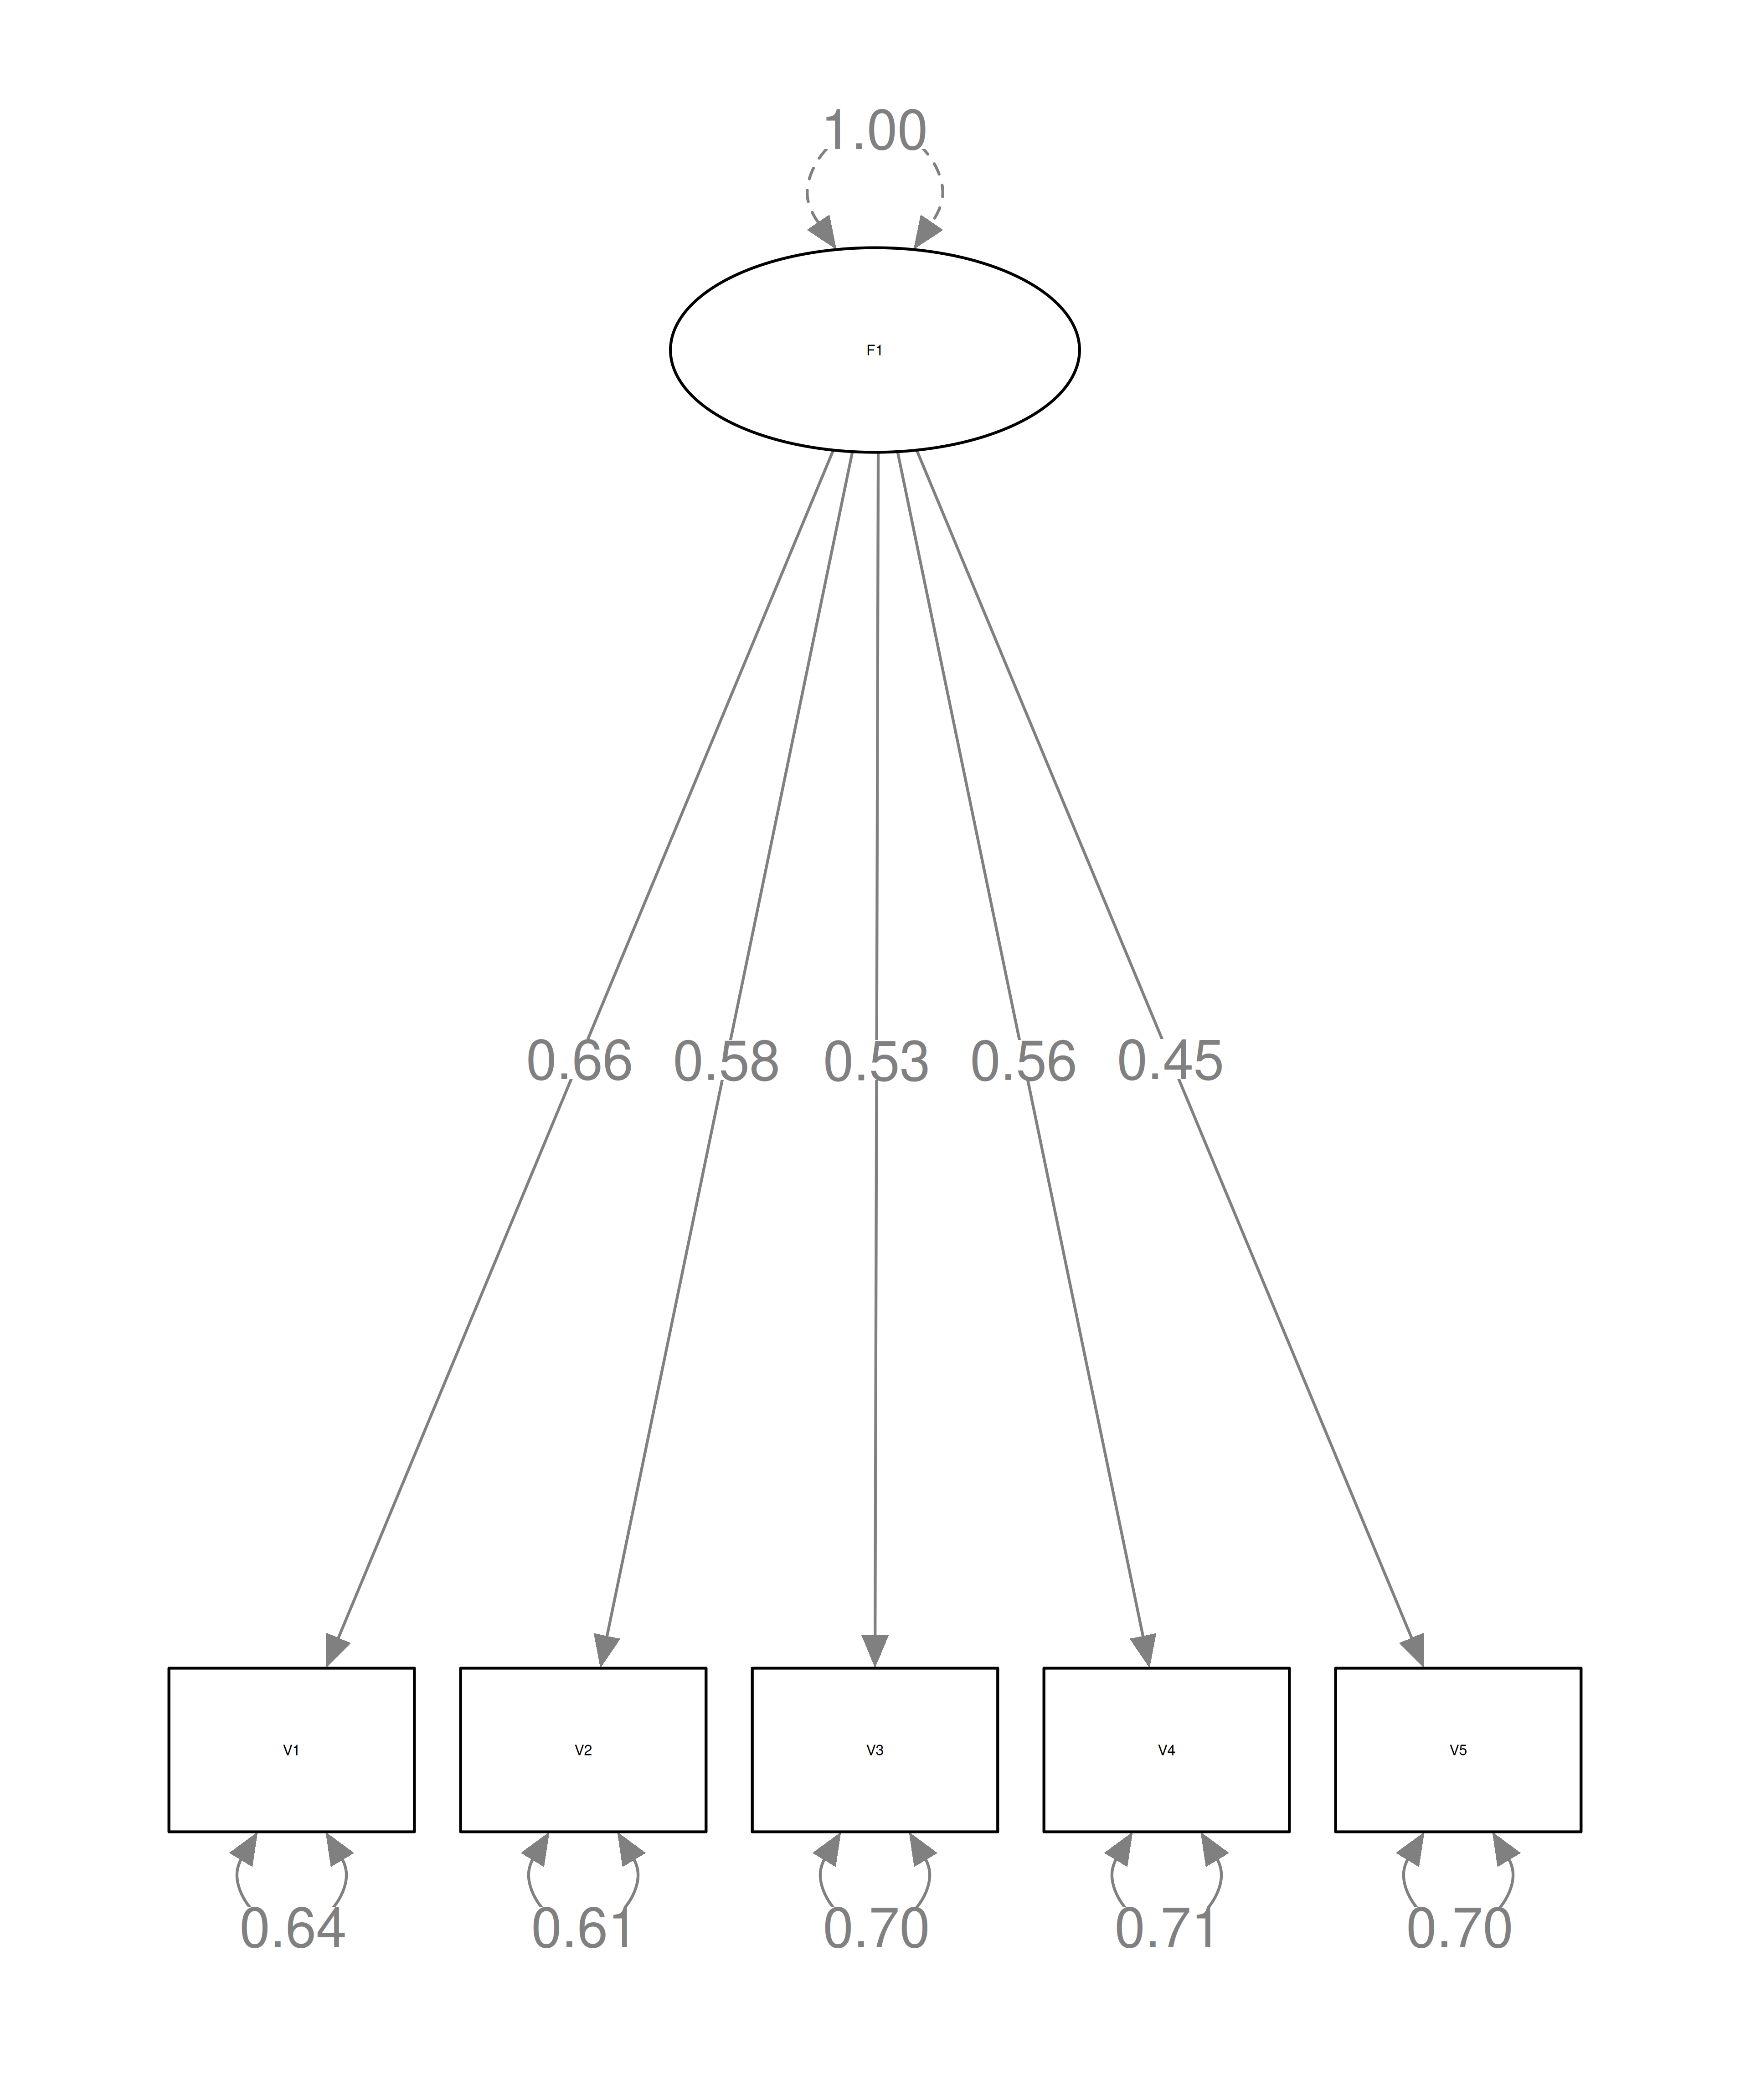
Using simulation to check a function
Illustrates using simulation to check my function based on a 1969 paper.

Bug in facetted ggplot with coord.fixed()
I think this is a bug, others disagree!
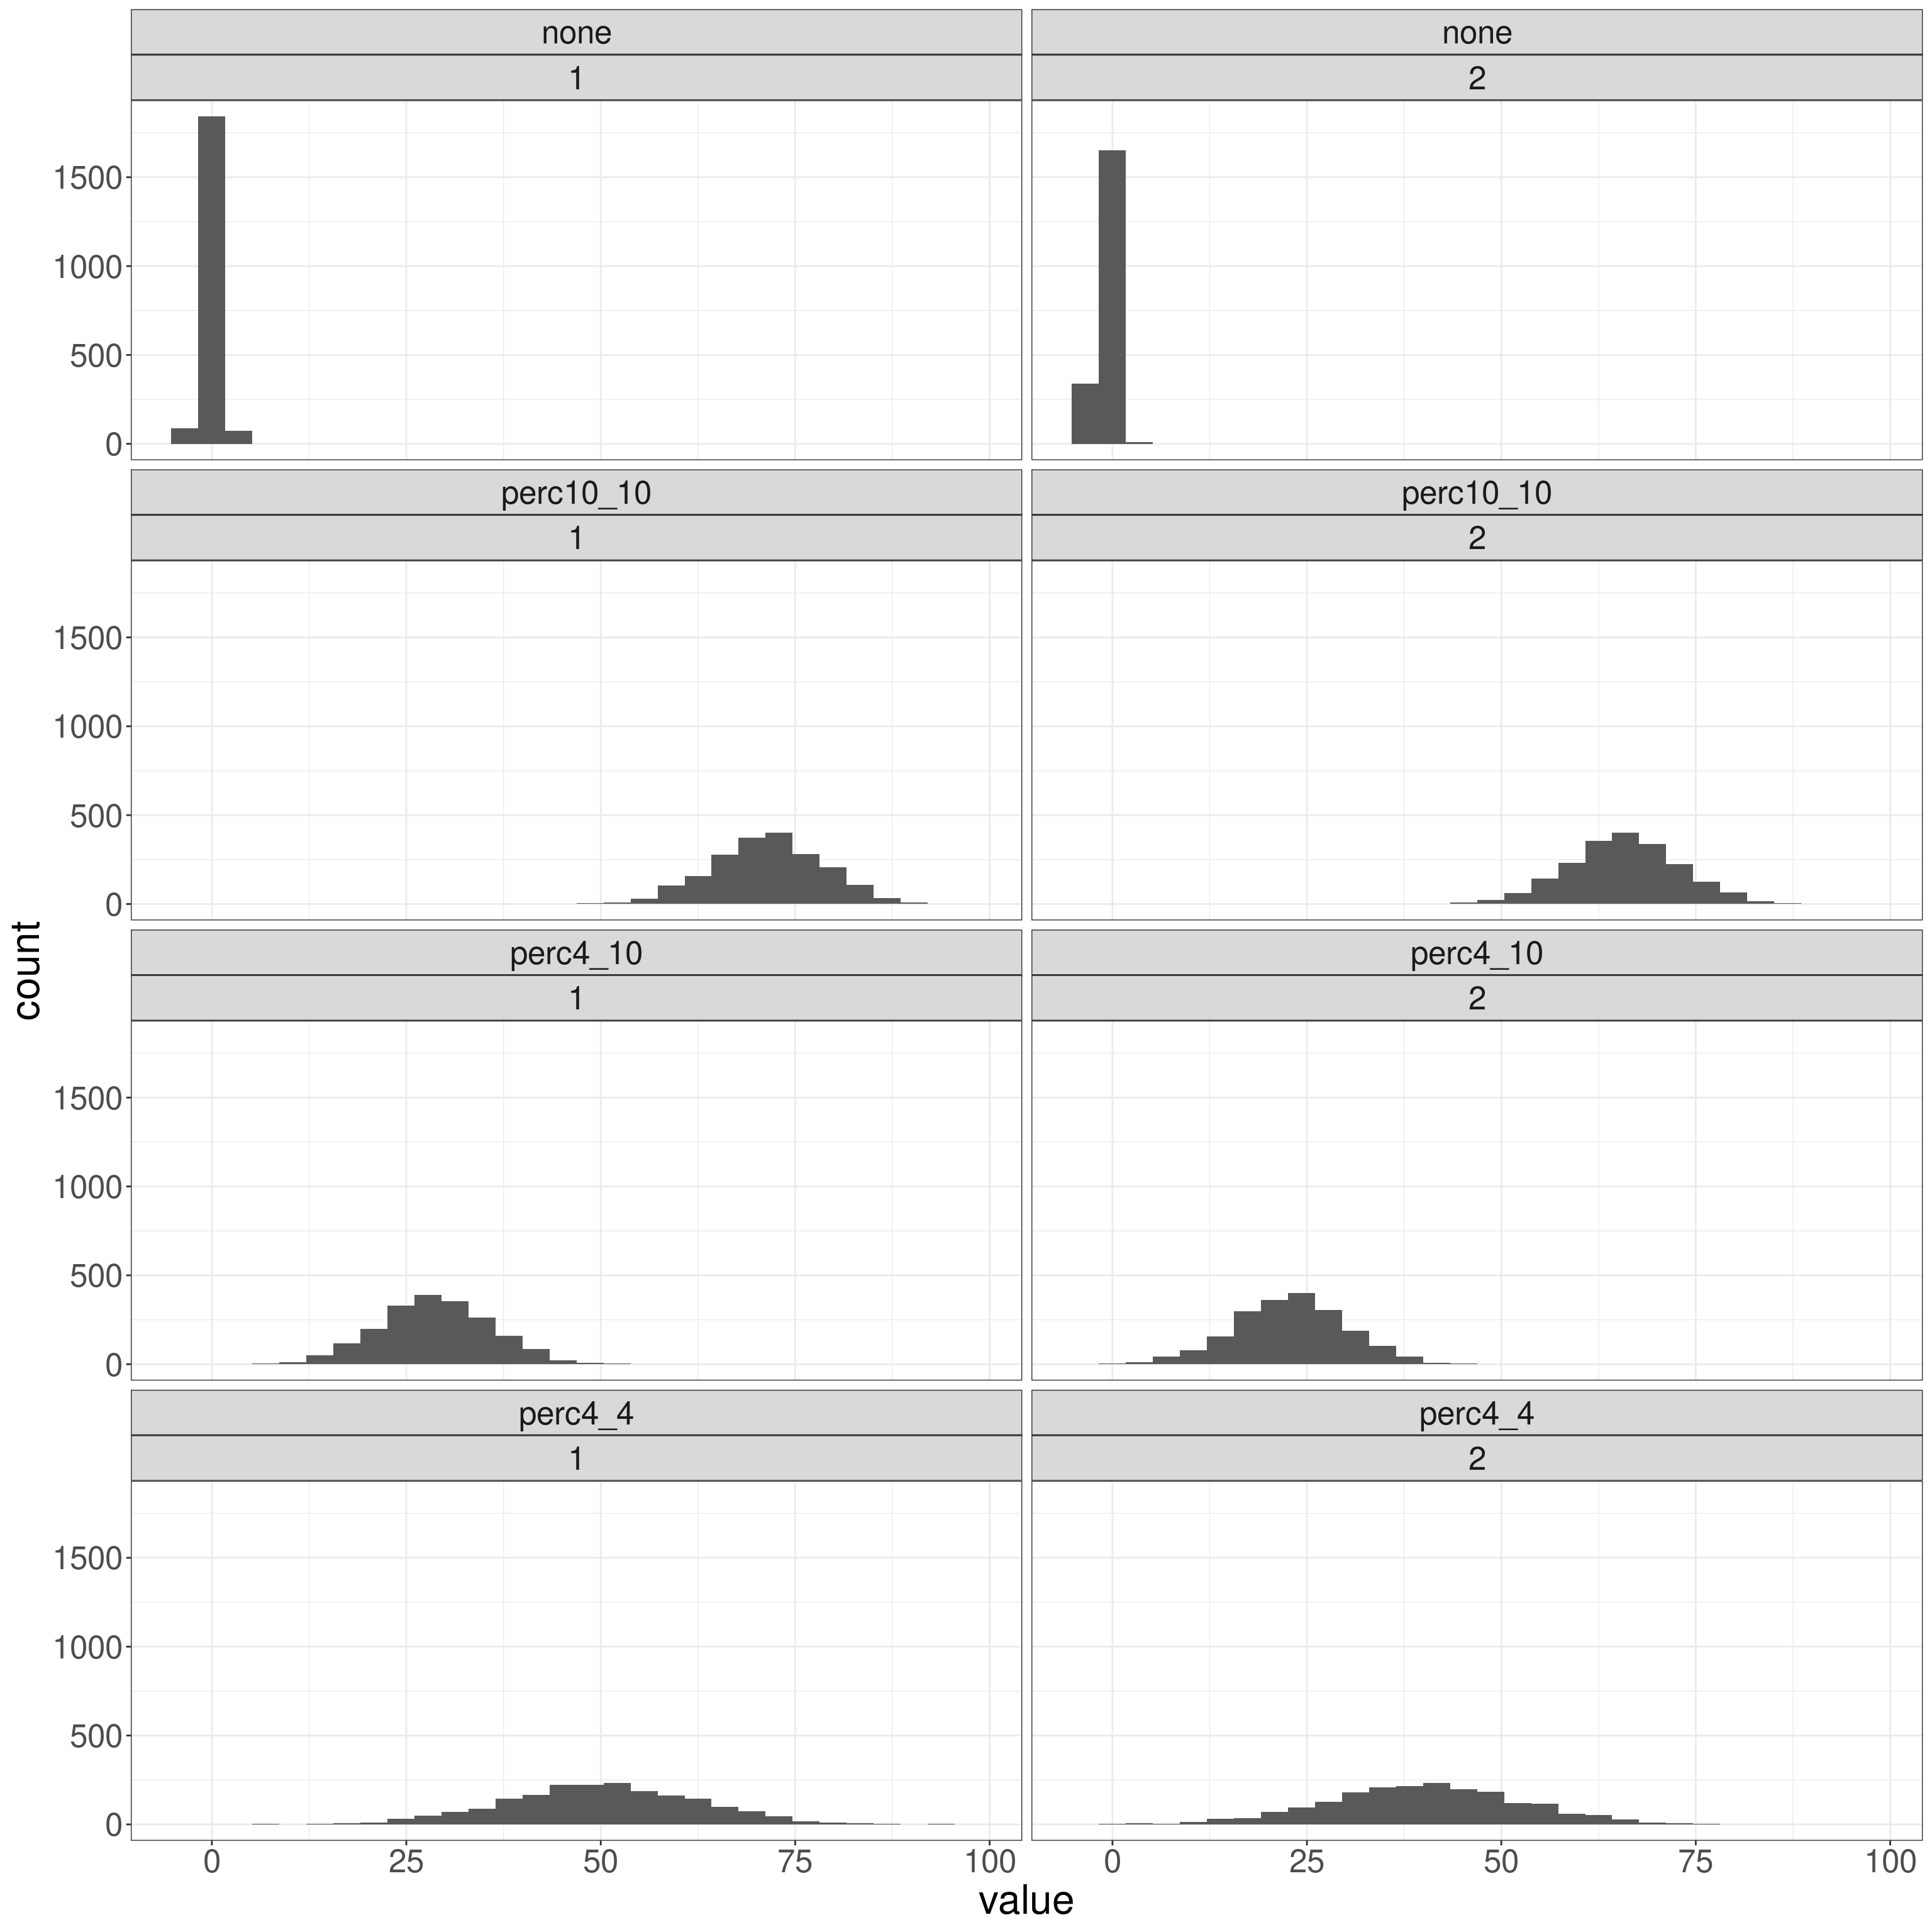
Percentage of possible score range
This explains why this transform can be misleading.

Convergent validity issues (1)
This expands the glossary entry about convergent validity

Dispersion
Post that will link closely to glossary entries and shiny apps all about dispersion, scatter, variance

Anonymising ODT and DOCX documents
Anonymising Libre/OpenOffice ODT and M$oft Wurd DOCX documents

CSC by gender and age
CSC matching lookup with lookupCSCgenderAndAge()

Hedges's g
A bit about Hedges's g!

Correlation coefficients (2)
Significance testing and confidence intervals for correlation coefficients ... and back to why!

Correlation coefficients (1)
Exploration of the differences between different correlation coefficients.

Bonferroni correction
A simple explanation of the Bonferroni correction for the multiple tests problem.

Confidence interval around Spearman correlation coefficient
Explores four methods of estimating a CI around an observed Spearman correlation.

Explore distributions with plots
Graphical exploration of fit between distributions and against theoretical distributions.

Tests of fit to Gaussian distribution
Introduction to four tests of fit to Gaussian distribution available in R

Kolmogorov-Smirnov test
First post about using R to test fit to univariate Gaussian (a.k.a. 'Normal') distribution: Kolmogorov-Test

Using tryCatch() (within simulations)
I had previously found the structure of tryCatch() difficult: cracked it!

Background on plotJacobson() function
1.xi.23 This is very early work in progress and will evolve a lot over the next week and then get into CECPfuns R package on github.

Confidence intervals for quantiles
A general coverage of quantiles, the ECDF (Empirical Cumulative Distribution Function) and confidence intervals (CIs) around quantiles

Mapping individual scores to referential data using quantiles
Exploring the use of quantiles and their confidence intervals, and ECDFs to map individuals' scores to referential data.

Making a working shiny server
This is very much work in progress and will probably always be that way.

What is an empirical cumulative distribution function?
A general introduction to the ECDF and quantiles and why they're useful.

Wisdom of years!
I've learned a lot about data analysis from my errors, here's what I wish I'd known earlier!

R things I, and perhaps others, forget
This is a developing miscellany of the things that I seem to keep forgetting about R. What I used to call in my student days "teflon coated facts"!

Jacobson #1
The Jacobson plot and RCSC (Reliable and Clinical Change) methods for those who have never met them before or don't feel confident they understand them.

Drawing a PSYCTC.org logo (and other circular things)
As title says: very simple stuff about circles in ggplot, does open up somne ideas about drawing therapy groups.

Derangements #2
Follows on from 'Scores from matching things'

Scores from matching things
Mostly about the method of derangements but some huxtable!

Reading data into R from M$oft Access mdb
Work in progress about reading data from M$ mdb file into R

Exact confidence intervals for difference between proportions
This describes the ExactCIdiff package, unpacks the arguments to the functions, looks at timings and notes an oddity, a typo I think, in the original paper about the package.
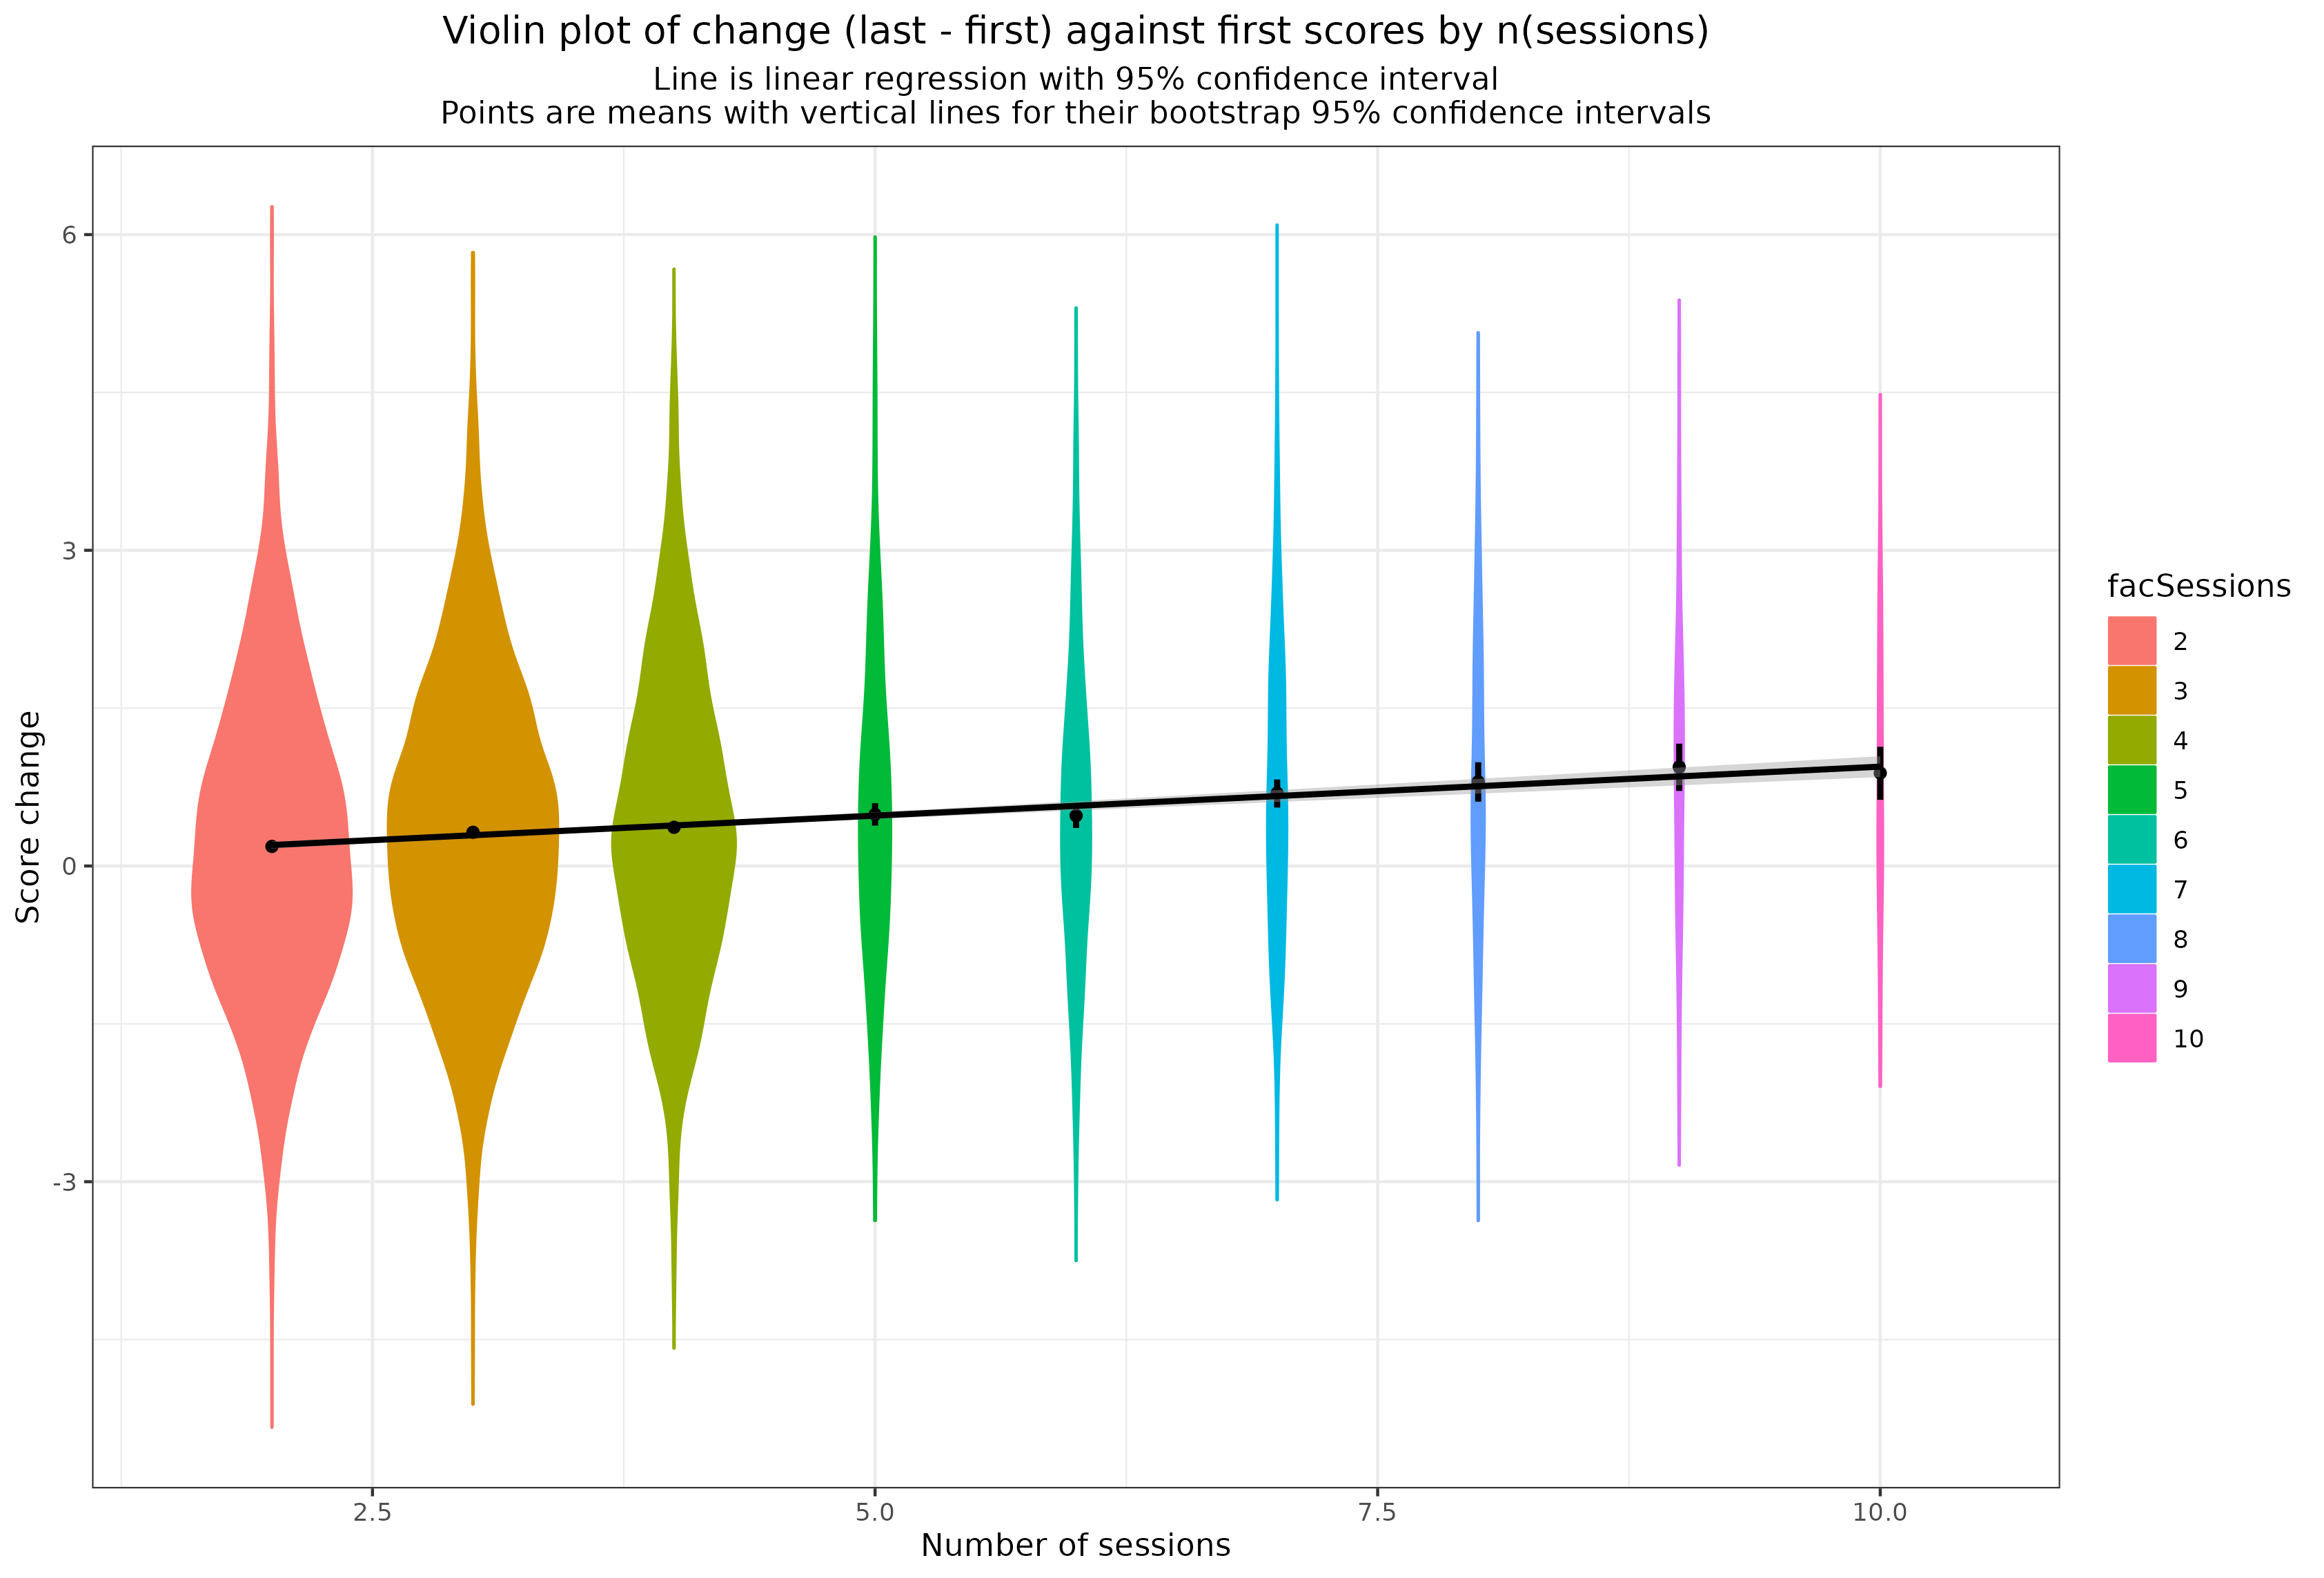
Pre/post analyses
Teaching myself about pre/post therapy change analyses using R. Probably the first of a series of posts.

Chance corrected agreement
Simple plotting of raw agreement and Cohen's kappa for various prevalences of the rated quality and only chance agreement
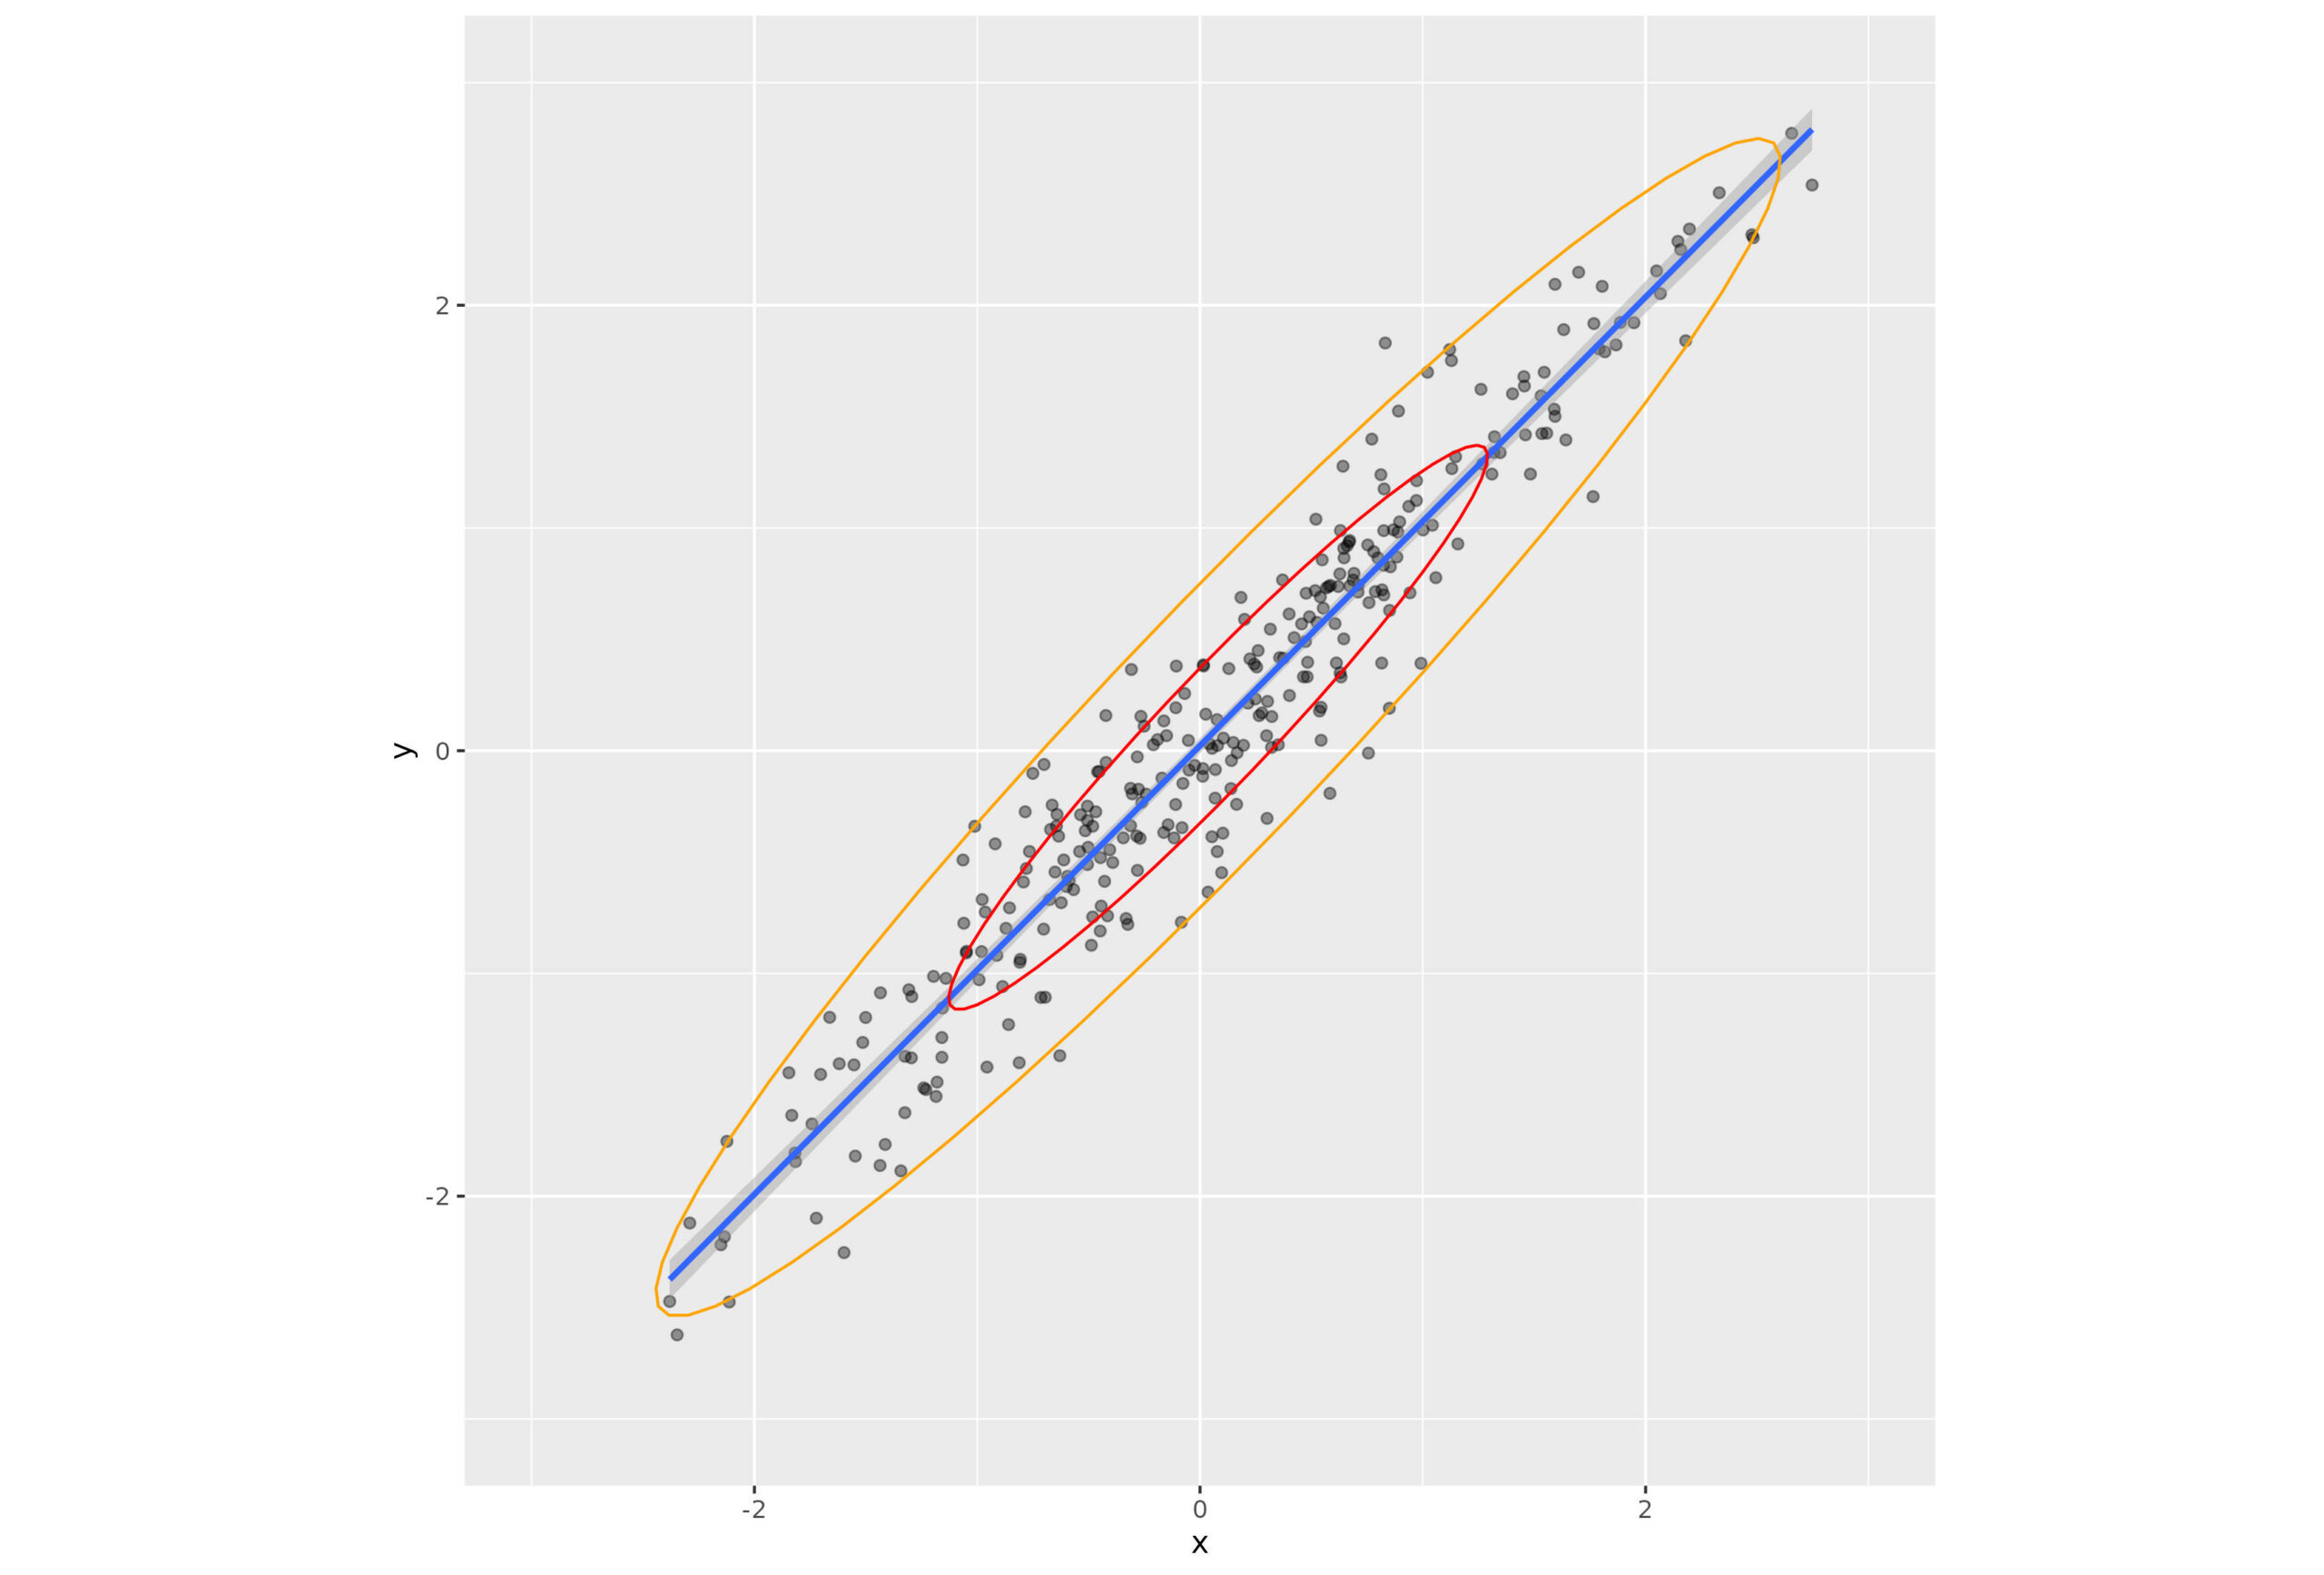
Data ellipses and confidence ellipses
This just clarifies the distinction between a data ellipse and a confidence ellipse, i.e. an ellipse describing the joint confidence intervals on two parameters of a model

Compiling packages reporting missing headers in windows
For anyone else who hits this and doesn't want to wait for someone to put the compiled package into CRAN

For OMbook glossary
Code used for entries in the glossary for the OMbook

Subscale/total correlations
A look at subscale/total correlations in the null model

Spearman-Brown formula
How does internal reliability relate to number of items?

Compiling R on a Raspberry Pi 4
I thought I should document this process as it turned out to be fairly easy

Where to store different settings in Rmarkdown files
This may be of use to others but it's partly for me as I keep forgetting these and searching around for the .Rmd files in which I used the one I want!

Making the CECPfuns package: my own usable package
This is very much work in progress so look for later posts about CECPfuns as well as this.

More piping, and rowwise()
This extends https://www.psyctc.org/Rblog/posts/2021-02-07-why-pipe-why-the-tidyverse/ and introduces rowwise()
Why pipe? Why the tidyverse?
A short description of the post.

How I have done this
Just documenting how I have created these pages with the Distill package.

Bootstrap_Spearman
A quick exploration of bootstrapping a Spearman and why you might, or might not, want it.

Handling overprinting
This is the first of my blog posts here, about the issue of overprinting and some ways to handle it using R and ggplot(). There's a small spin off topic on the impact on bivariate correlations and on linear regression of discretising continuous variables.

Nudging groupings on plot axes
How to nudge categories on an axis of a ggplot plot.
Categories
- Articles (51)
- Agreement (2)
- Bootstrapping (1)
- CECPfuns package (4)
- Change scores (1)
- Cohen's kappa (2)
- Confidence intervals (5)
- Correlation (11)
- Data import in R (1)
- Data protection (1)
- Database handling (1)
- Demonstration (1)
- Distill package (2)
- Distribution tests (2)
- Distributions (6)
- ECDFs (3)
- Effect sizes (1)
- Exact confidence intervals (1)
- Gaussian distribution (4)
- Geeky stuff (3)
- Granularity of scores (1)
- Graphics (3)
- Jacobson plot (2)
- Jittering (2)
- Mapping to referential data (1)
- Method of derangements (2)
- Multiple tests problem (1)
- n=1 (1)
- Non-parametric statistics (1)
- Nudging (1)
- Null hypothesis tests (NHSTs) (6)
- OMbook & glossary (1)
- Overprinting (1)
- p values (1)
- Piping (2)
- Plots and graphs (2)
- Pre/post change (1)
- Proportions (1)
- Psychometrics (4)
- Quantiles (quartiles, [per]centiles, deciles) (2)
- R geeky (1)
- R graphics (9)
- R markdown (1)
- R packages (5)
- R programming (8)
- R style (1)
- R tricks (17)
- Rank methods (1)
- Ranking (1)
- Raspberry pi (1)
- RCSC paradigm (3)
- Regression (3)
- Reliability (3)
- Reminder (for CE!) (1)
- Rigorous idiography (2)
- Rmarkdown (1)
- Shiny (1)
- Simulation (4)
- Standardising (1)
- Tidyverse (3)
- Time series (1)
- Transformations (2)
- Wise practices (1)