This is an interesting phenomenon which should perhaps be called the multiple tests issue but yes, it does create a problem knowing what to make of significance tests when you do more than one of them.
The key idea in statistical “tests” is that even before you do a study and plan into it a test of something, you set a criterion risk you are willing to run of saying on the basis of your data that something systematic is happening when in fact that is just a “sampling vagary”: your data happened to look interesting but another sample, another time, wouldn’t. The convention is to set the risk at one in twenty, the famous “p = .05”. That means that you reject the null hypothesis that nothing systematic is happening if your test says that a result as interesting looking, or more interesting, would have happened by chance sampling from that null hypothesis population in which nothing systematic is happening less often than one time in twenty: p < .05.
That’s “tests” or the NHST: Null Hypothesis Significance Testing paradigm and there’s more on that in other entries here, see below.
This is fine for one test but what happens if you have more than one question of interest. Now you hit the multiple tests issue, or problem.
Details #
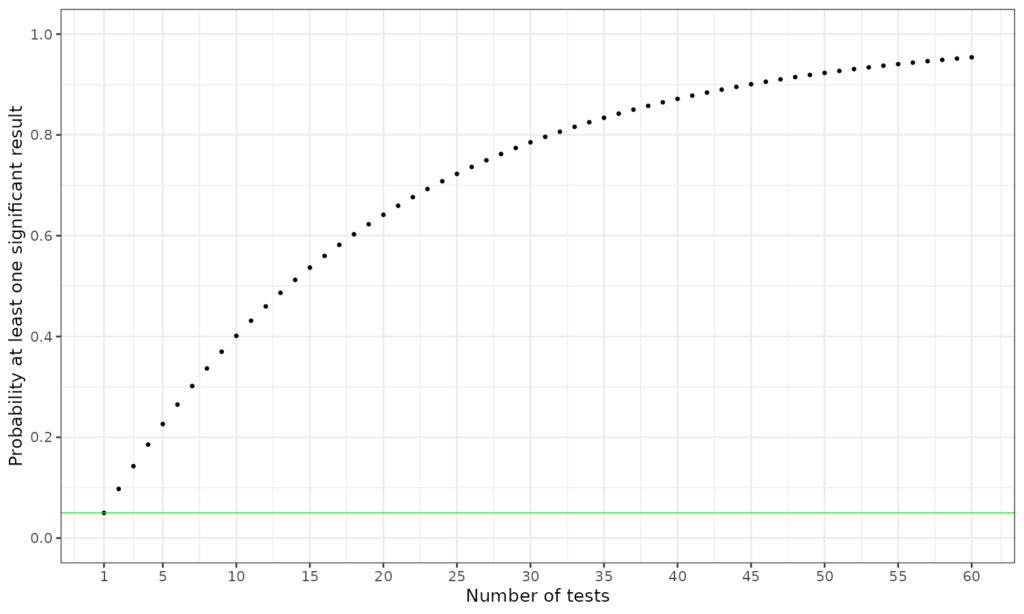
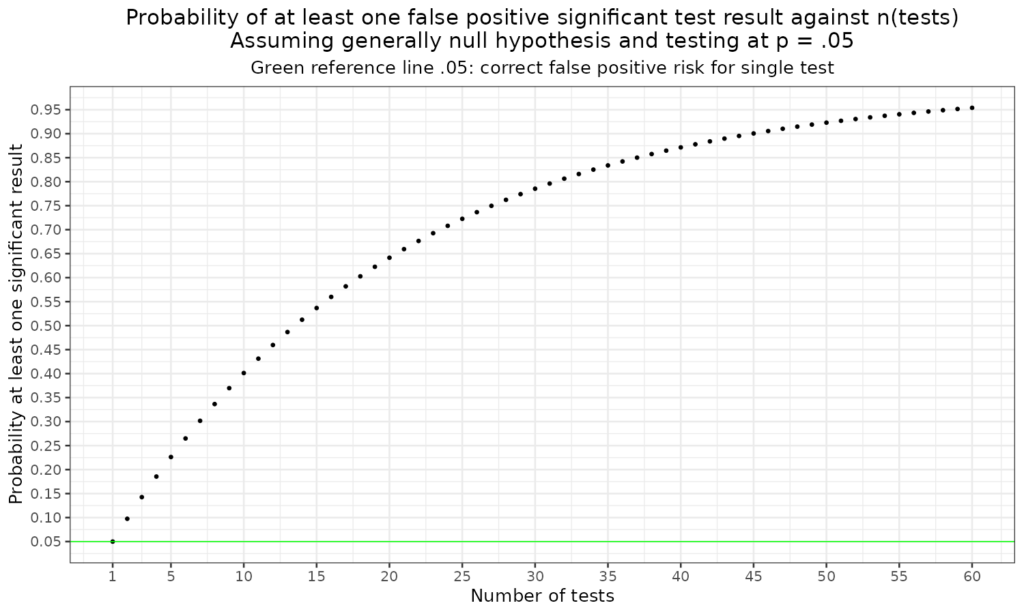
The problem is that if you do more than one test, the risk of at least one one of them coming up with p < .05 false positive, if the general null hypothesis is true for the population, i.e. that none of the effects you are testing for is really there, goes up rapidly from .05 for a single test, to .0975 for two tests, .143 for three and so on. The header graphic shows this. This next plot just puts labels and titles onto it.
Here is the full table of that.
| nTests | Probability at least one test significant |
|---|---|
| 1 | 0.05 |
| 2 | 0.10 |
| 3 | 0.14 |
| 4 | 0.19 |
| 5 | 0.23 |
| 6 | 0.26 |
| 7 | 0.30 |
| 8 | 0.34 |
| 9 | 0.37 |
| 10 | 0.40 |
| 11 | 0.43 |
| 12 | 0.46 |
| 13 | 0.49 |
| 14 | 0.51 |
| 15 | 0.54 |
| 16 | 0.56 |
| 17 | 0.58 |
| 18 | 0.60 |
| 19 | 0.62 |
| 20 | 0.64 |
| 21 | 0.66 |
| 22 | 0.68 |
| 23 | 0.69 |
| 24 | 0.71 |
| 25 | 0.72 |
| 26 | 0.74 |
| 27 | 0.75 |
| 28 | 0.76 |
| 29 | 0.77 |
| 30 | 0.79 |
| 31 | 0.80 |
| 32 | 0.81 |
| 33 | 0.82 |
| 34 | 0.83 |
| 35 | 0.83 |
| 36 | 0.84 |
| 37 | 0.85 |
| 38 | 0.86 |
| 39 | 0.86 |
| 40 | 0.87 |
| 41 | 0.88 |
| 42 | 0.88 |
| 43 | 0.89 |
| 44 | 0.90 |
| 45 | 0.90 |
| 46 | 0.91 |
| 47 | 0.91 |
| 48 | 0.91 |
| 49 | 0.92 |
| 50 | 0.92 |
| 51 | 0.93 |
| 52 | 0.93 |
| 53 | 0.93 |
| 54 | 0.94 |
| 55 | 0.94 |
| 56 | 0.94 |
| 57 | 0.95 |
| 58 | 0.95 |
| 59 | 0.95 |
| 60 | 0.95 |
This is actually basic binomial distribution: here are the probabilities of the numbers of falsely significant tests assuming the general null applies and the criterion for significance is p < .05.
| nTests | nSig:0 | nSig:1 | nSig:2 | nSig:3 | nSig:4 | nSig:5 | nSig:6 | nSig:7 | nSig:8 |
|---|---|---|---|---|---|---|---|---|---|
| 1 | 0.95 | 0.05 | NA | NA | NA | NA | NA | NA | NA |
| 2 | 0.90 | 0.10 | 0.0025 | NA | NA | NA | NA | NA | NA |
| 3 | 0.86 | 0.14 | 0.0071 | 0.0001 | NA | NA | NA | NA | NA |
| 4 | 0.81 | 0.17 | 0.0135 | 0.0005 | 0 | NA | NA | NA | NA |
| 5 | 0.77 | 0.20 | 0.0214 | 0.0011 | 0 | 0 | NA | NA | NA |
| 6 | 0.74 | 0.23 | 0.0305 | 0.0021 | 0.0001 | 0 | 0 | NA | NA |
| 7 | 0.70 | 0.26 | 0.0406 | 0.0036 | 0.0002 | 0 | 0 | 0 | NA |
| 8 | 0.66 | 0.28 | 0.0515 | 0.0054 | 0.0004 | 0 | 0 | 0 | 0 |
The “NA” entries there are the R convention for missing data: “Not Available” and clearly you can’t have three significant tests if you only did two tests! The columns that do have values are showing the probabilities of finding that number of tests significant given the general null model. The probabilities for one or more significant tests, i.e. taking the sum across the those columns give the probabilities of at least one significant test that I showed for up to 60 tests in the earlier table.
Clearly this means that if the literature is full of work where more than one test was reported and all were reported using the p < .05 criterion then there is a worryingly high likelihood, greater than p = .05, perhaps much greater than that, that some of these supposedly significant findings are spurious.
This doesn’t rule out doing multiple tests on data: if you have many questions of interest and have collected a lot of data with the support of the clients who contributed the data then there’s a clear need to do the tests. There are no perfect solutions to this “multiple tests problem” though. Careful workers at least report the risk, more sophisticated options are to apply “corrections” to remove the problem. The most famous of these is the Bonferroni correction which is a very thorough correction as it really does remove the problem but with the catch that it reduces statistical power dramatically as the number of tests you conduct goes up. There are other corrections that are sometimes robust enough for many plausible situations, and are less conservative than the Bonferroni correction. This is is a tricky area where ideally you work with an experienced researcher and/or a statistician.
Try also #
Bonferroni correction
Binomial distribution
False Discovery Rate (FDR)
Null hypothesis testing
Null hypothesis significance testing (NHST) paradigm
Population
Sampling and sample frame
Chapters #
Probably should have been in Chapter 5 … but you can’t have everything in a small book!
Online resources #
Rblog post about the Bonferroni correction
Shiny app to look at costs of the correction in terms of statistical power
Dates #
First created 20.xi.23, most recent tweaks, just to the wording, 8.ii.25.

