For our purposes a skew distribution is an asymmetric one: one which has a longer tail towards either higher scores or lower scores rather than two fairly equally long tails. This matters to us for two reasons.
- Distributions of scores from different clients on our measures are rarely symmetrical, and
- Traditional (“parametrical”) statistical methods assume symmetrical (actually generally one specific symmetrical distribution: the Gaussian or “Normal” distribution) and can be quite misleading when applied to skew distributions.
Details #
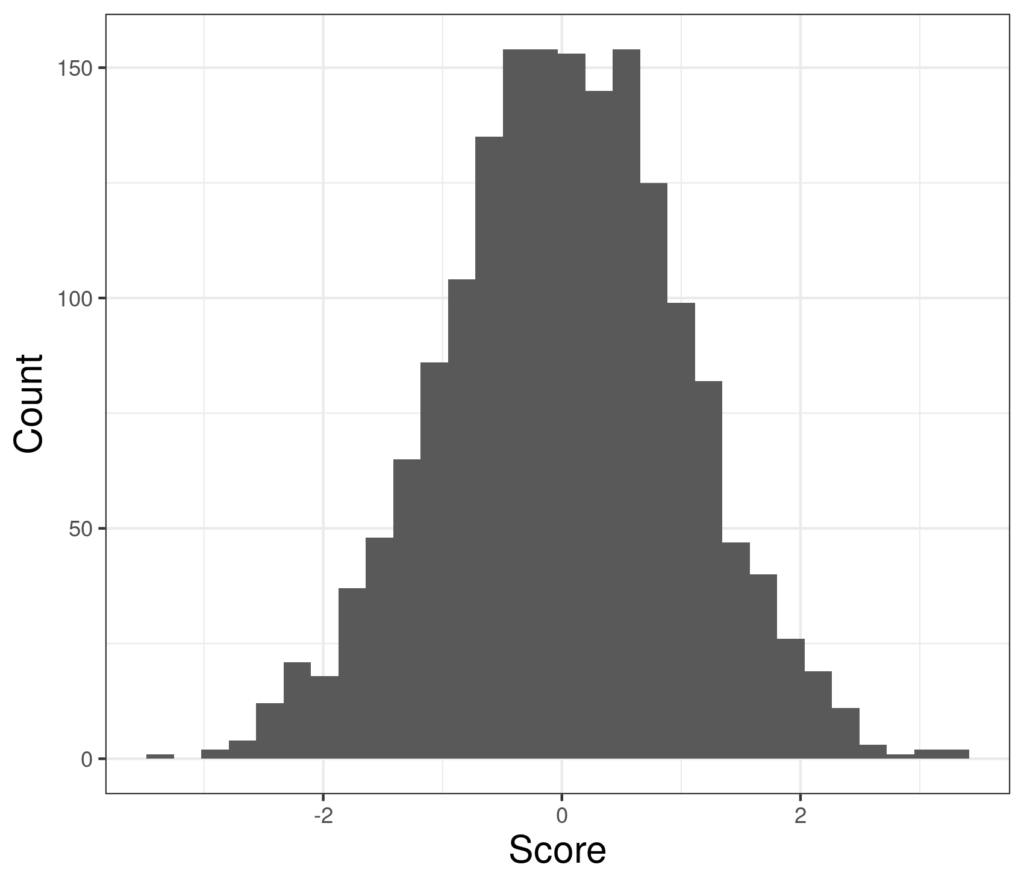
Here is a histogram of a symmetrical distribution.

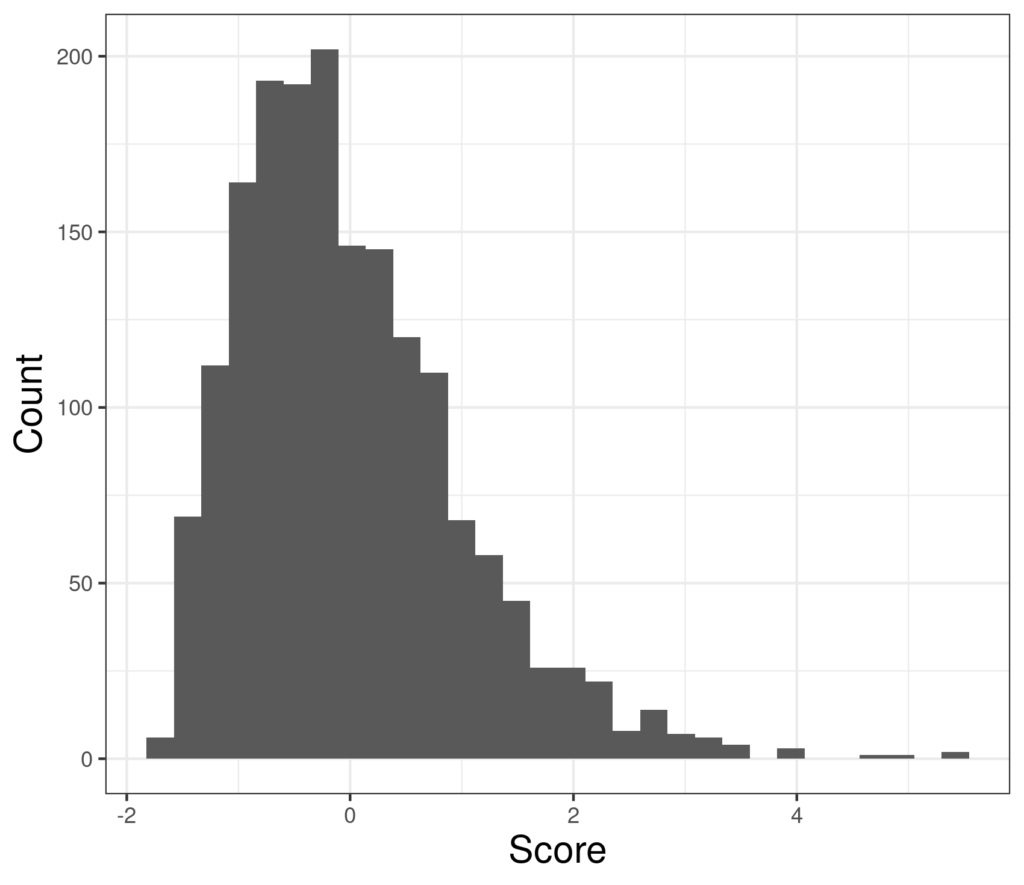
Here is a histogram of a positively skew distribution.

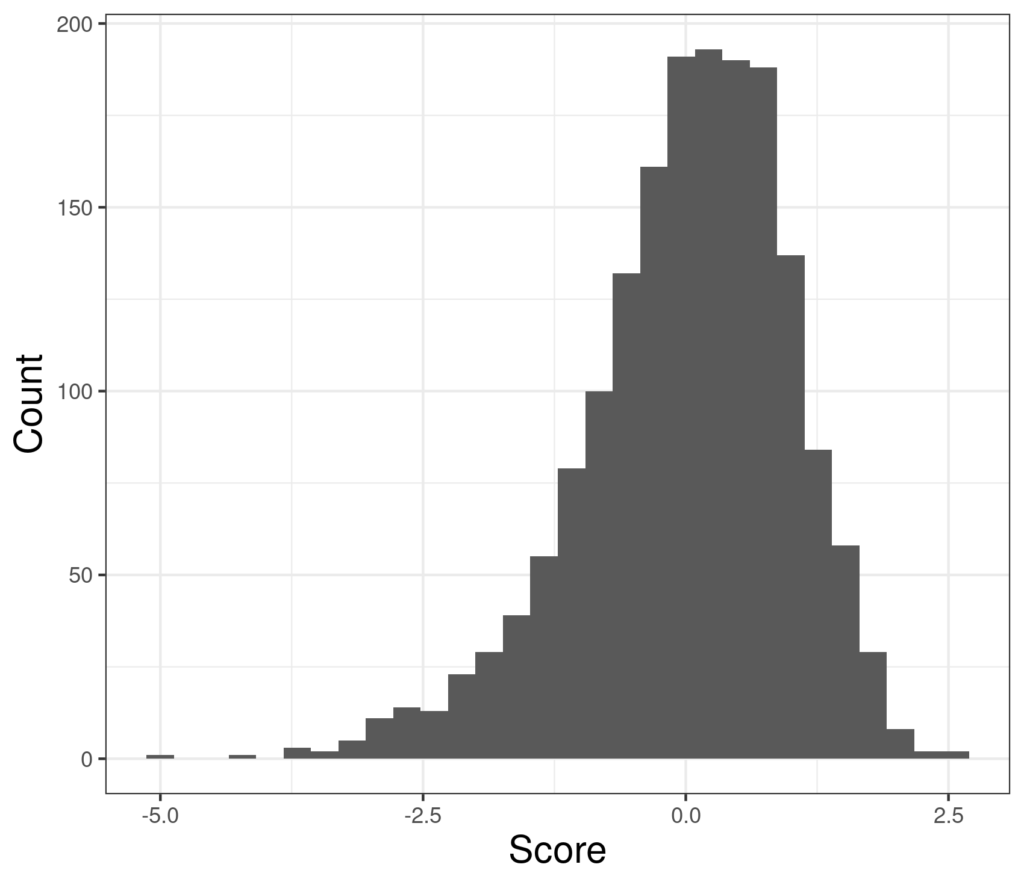
You can see that the tail of the distribution goes off to the right, to the higher scores. Finally, here is a negatively skew distribution.

Try also #
Distribution
Histogram
Chapters #
Chapter 5
Online applications #
In due course I hope to have a shiny app to plot histograms of data.
Dates #
Created 1/11/21

