Licensing
Cartoons from xkcd by courtesy of Randall Munroe, see his generous Creative Commons licence.
CORE-OM figures also licenced by CORE System Trust under a Creative Commons (CC) licence, see details on CORE site.
Figure 9.1 anonymous but free to reproduce.
All other figures created by CE and made available here under CC Attribution-ShareAlike licence.
Figure 1.1 xkcd cartoon: boyfriend

Figure 2.1 xkcd cartoon: pain rating

Figure 3.1 xkcd cartoon: probability

Figure 4.1 Page 1 of the CORE-OM
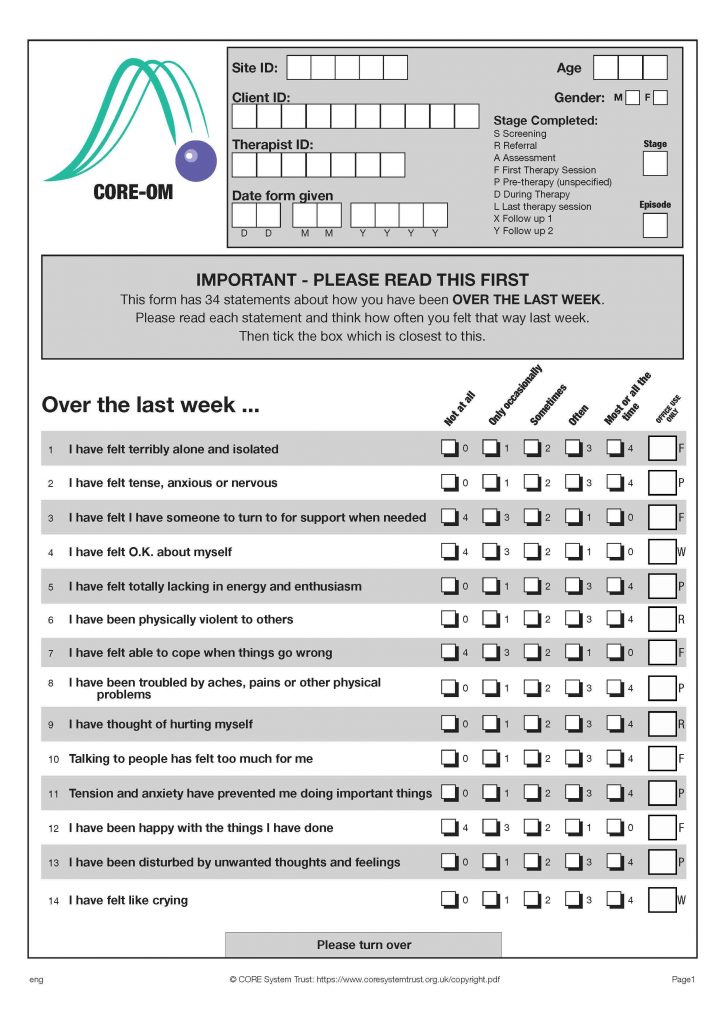
Figure 4.2 Page 2 of the CORE-OM
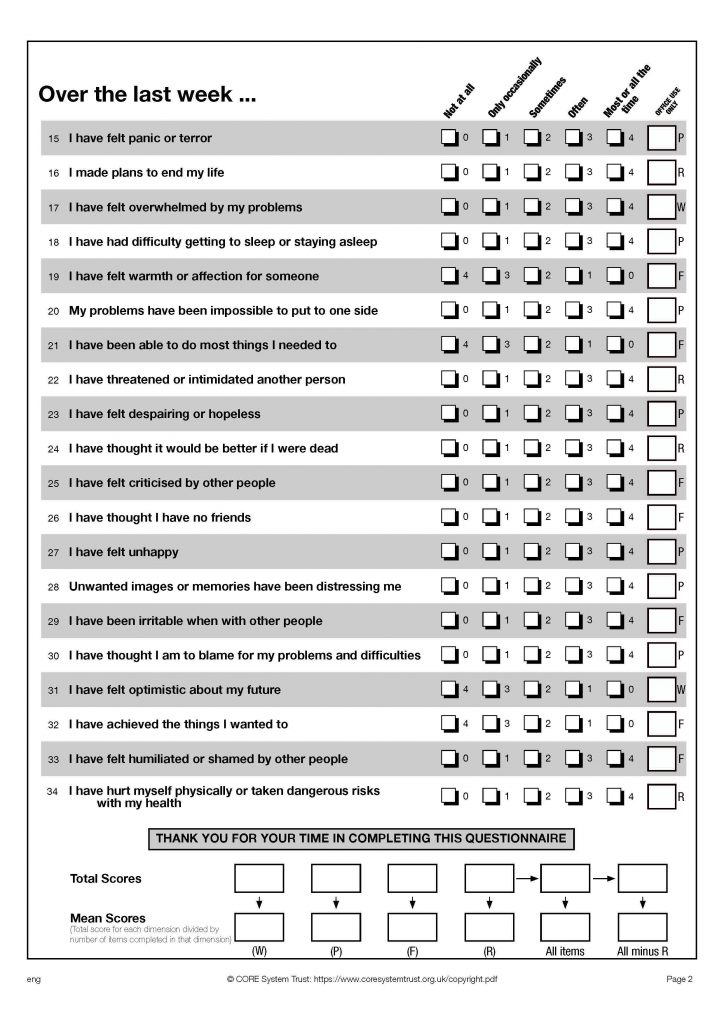
Figure 5.1 Simple cat’s cradle plot
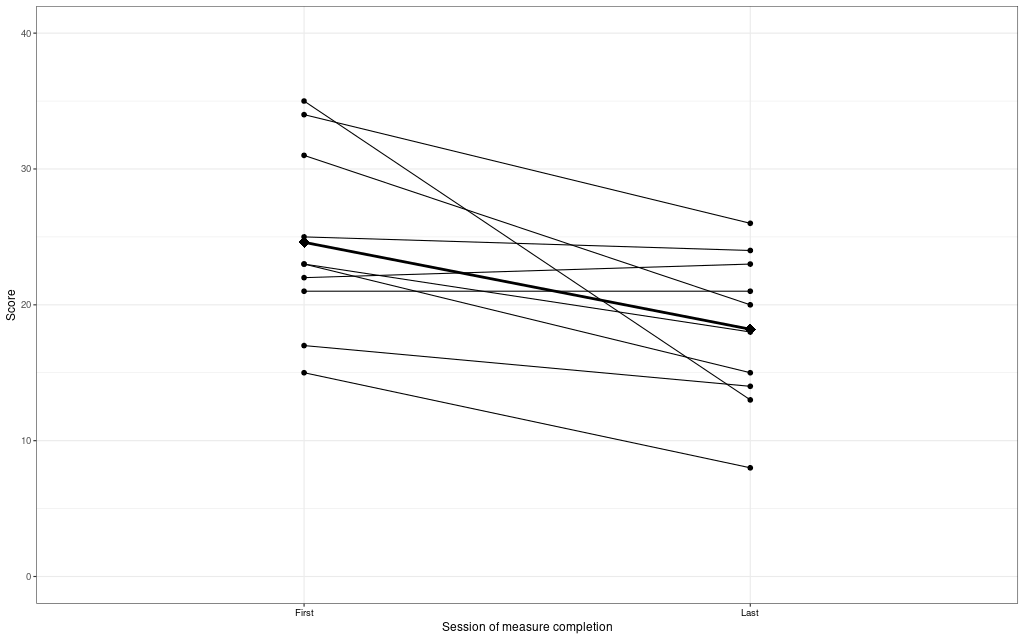
Figure 5.2 Pre-Jacobson plot: scattergram of final against starting scores
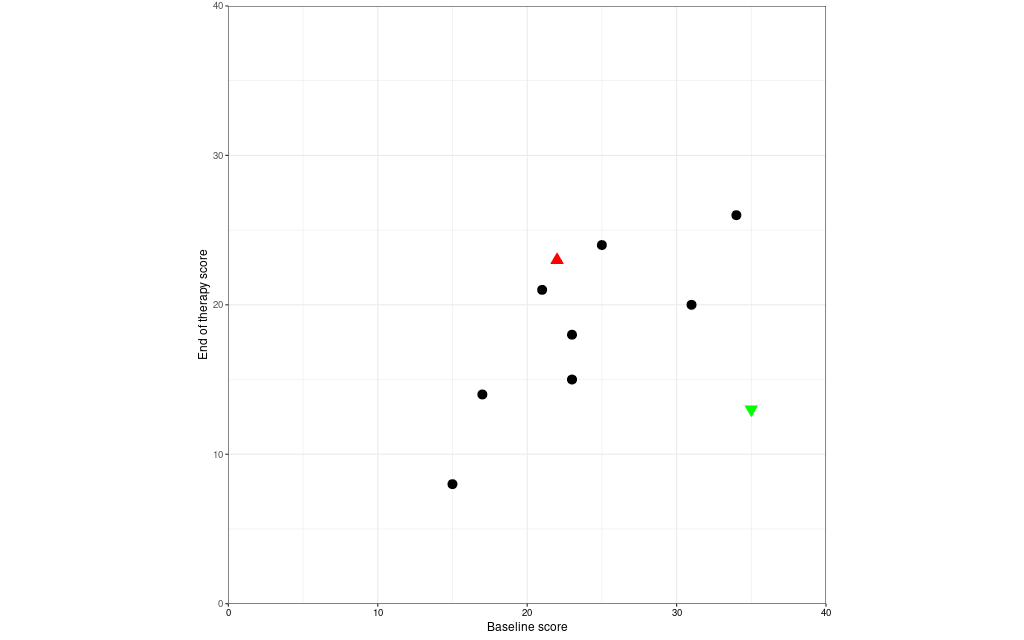
Figure 5.3 Pre-Jacobson plot: scattergram with leading diagonal
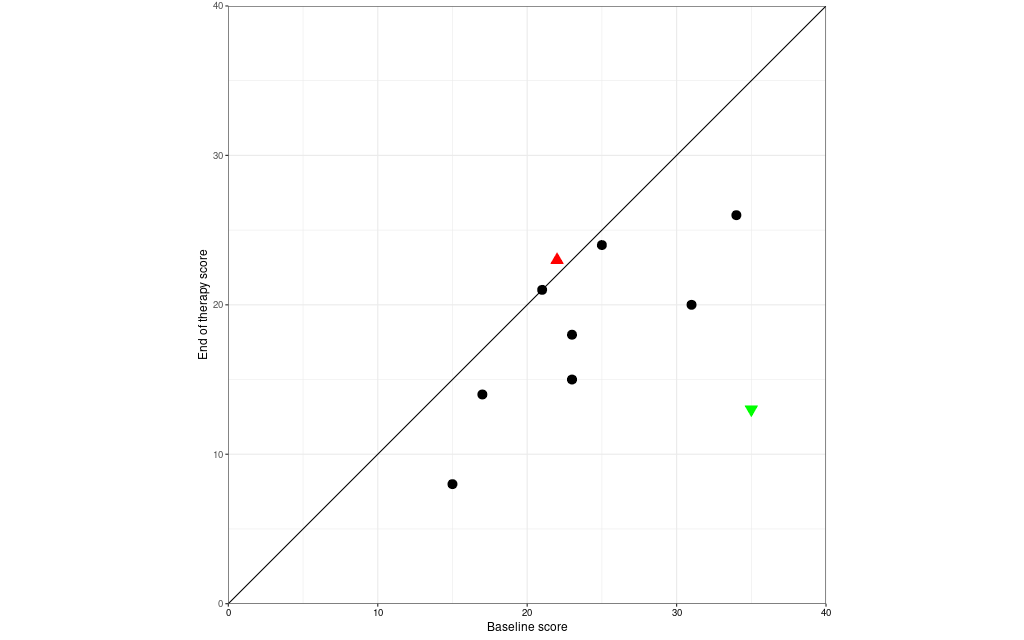
Figure 5.4 Pre-Jacobson plot: scattergram with diagonal and RCI tramlines
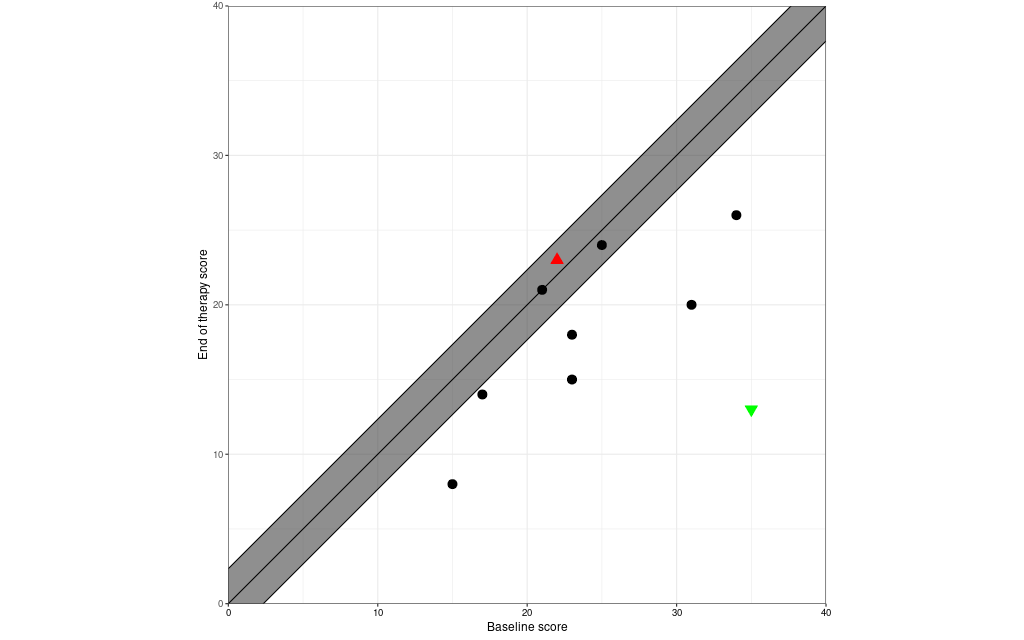
Figure 5.5 Finished Jacobson plot
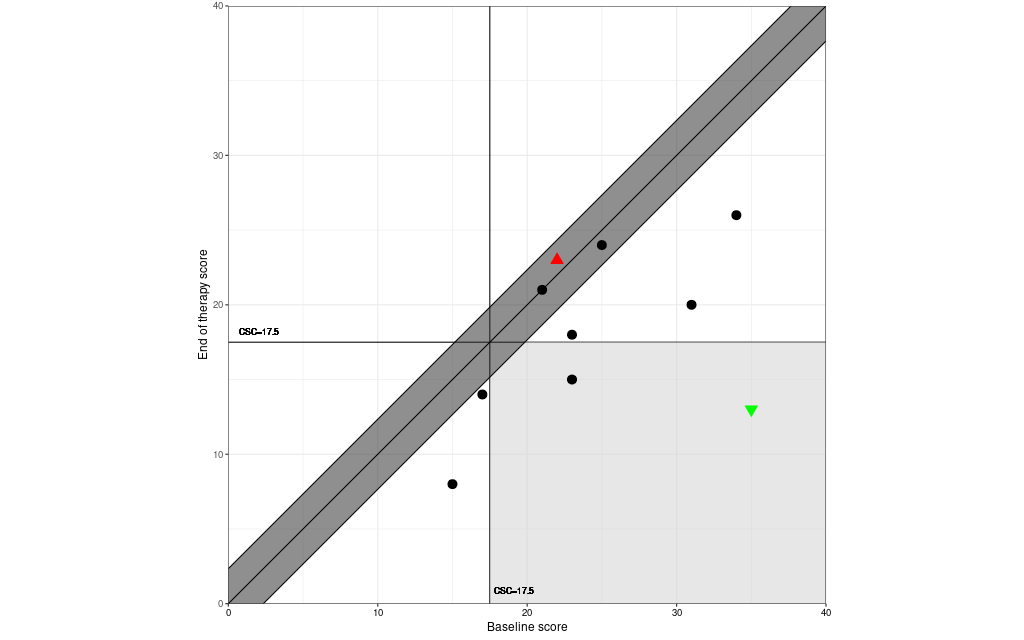
Figure 5.6 Time-stretched cat’s cradle plot
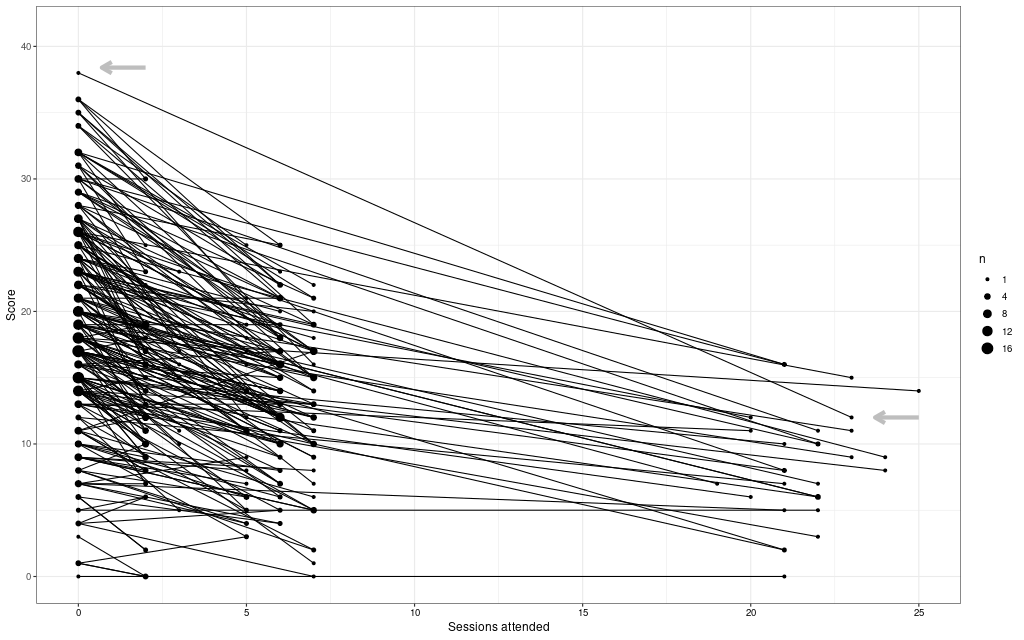
Figure 5.7 Jacobson plot of change (n = 240)
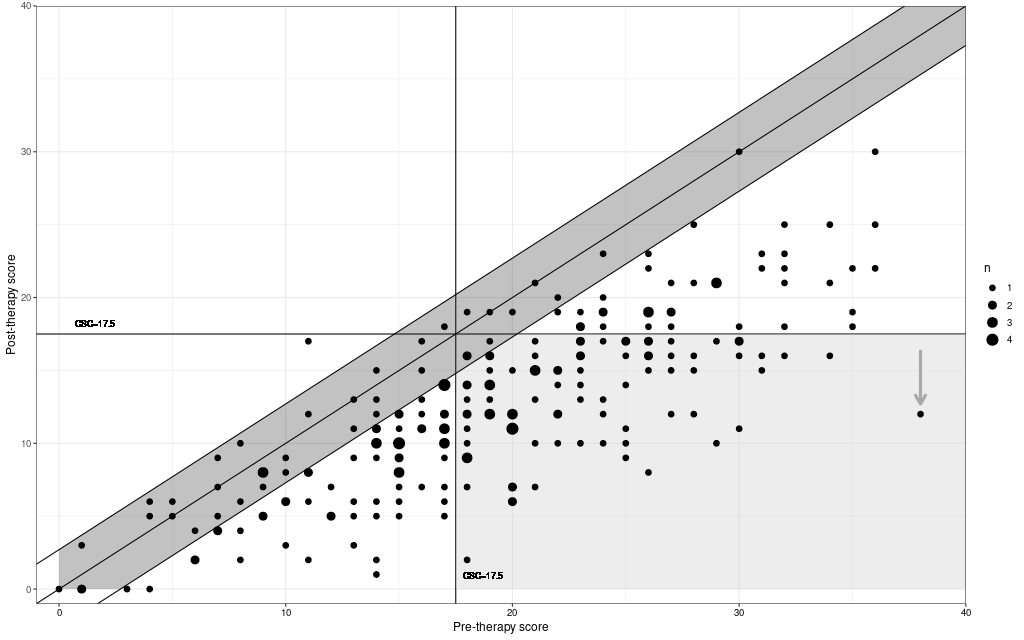
Figure 5.8 Histogram of attendance
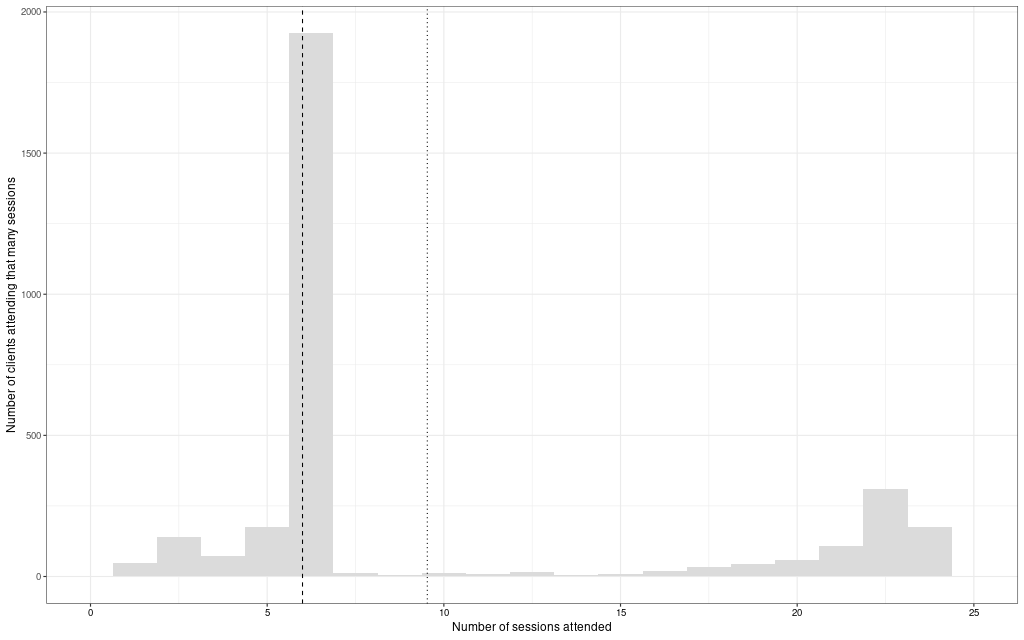
Figure 5.9 Boxplot of attendance

Figure 5.10 Grouped boxplot of attendance by gender
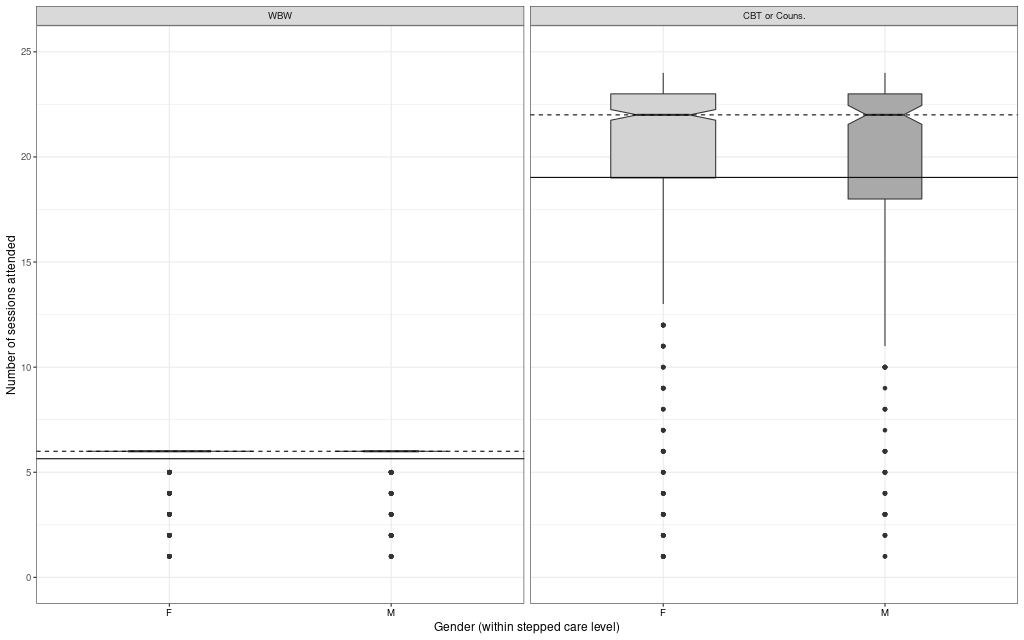
Figure 5.11 Boxplot of baseline PHQ-9 scores by gender
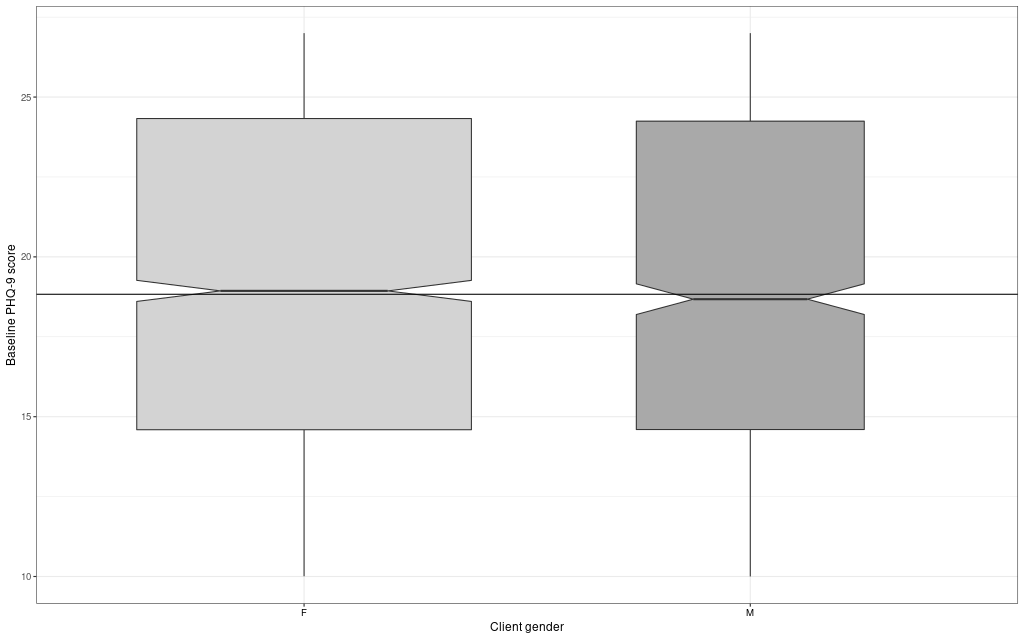
Figure 7.1 Odds ratio of effect of gender on therapy duration: null population model
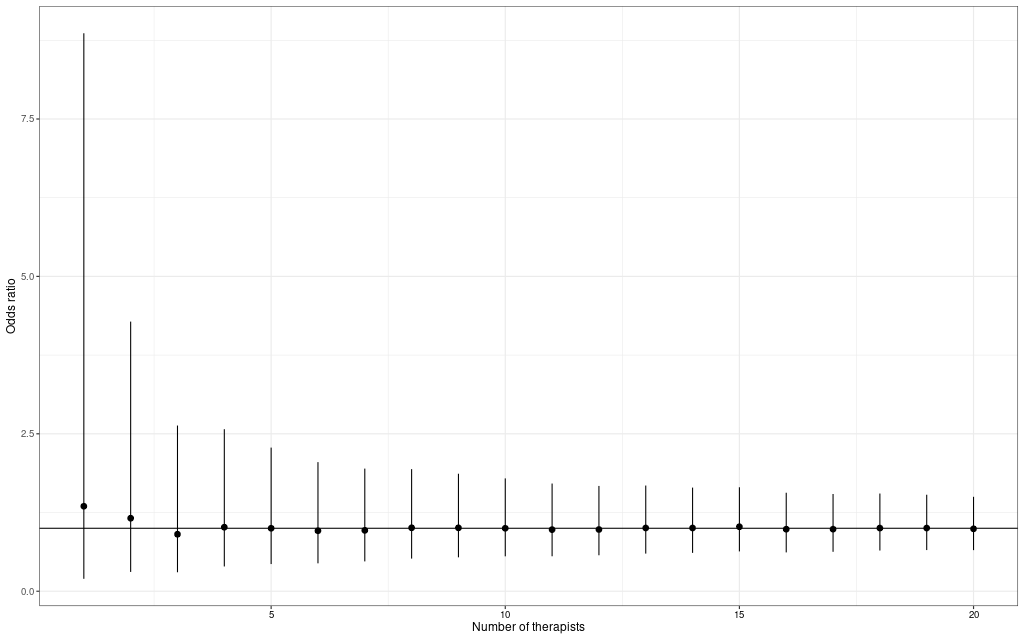
Figure 7.2 Odds ratio of effect of gender on therapy duration: non-null population model
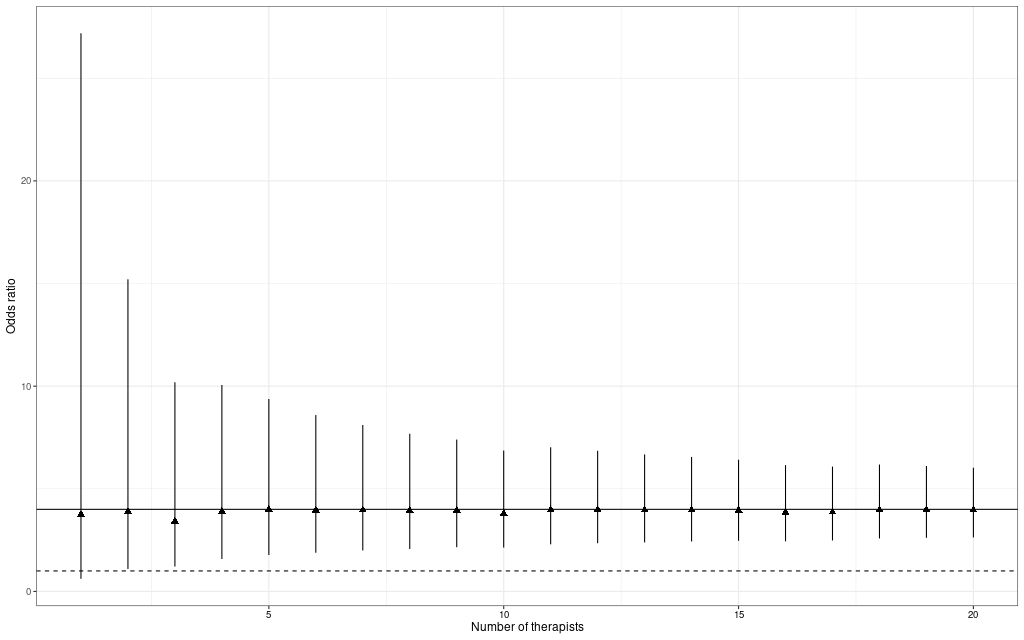
Figure 7.3 Odds ratio of effect of gender on therapy duration: both population models
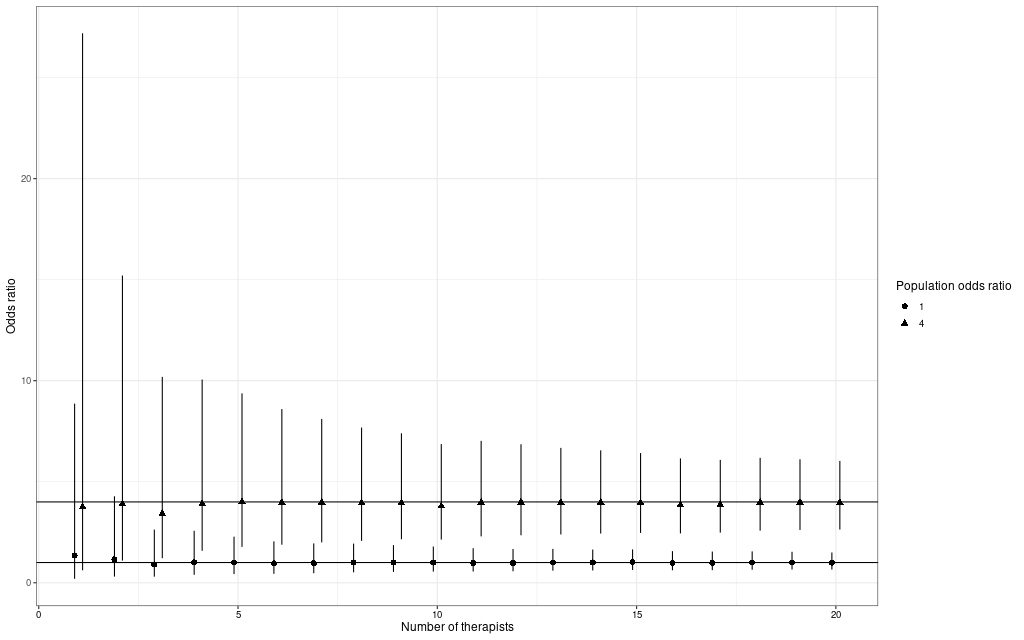
Figure 8.1 Scatterplot with linear regression: PHQ change against sessions attended

Figure 8.2 Scatterplot: PHQ change against sessions attended by care step
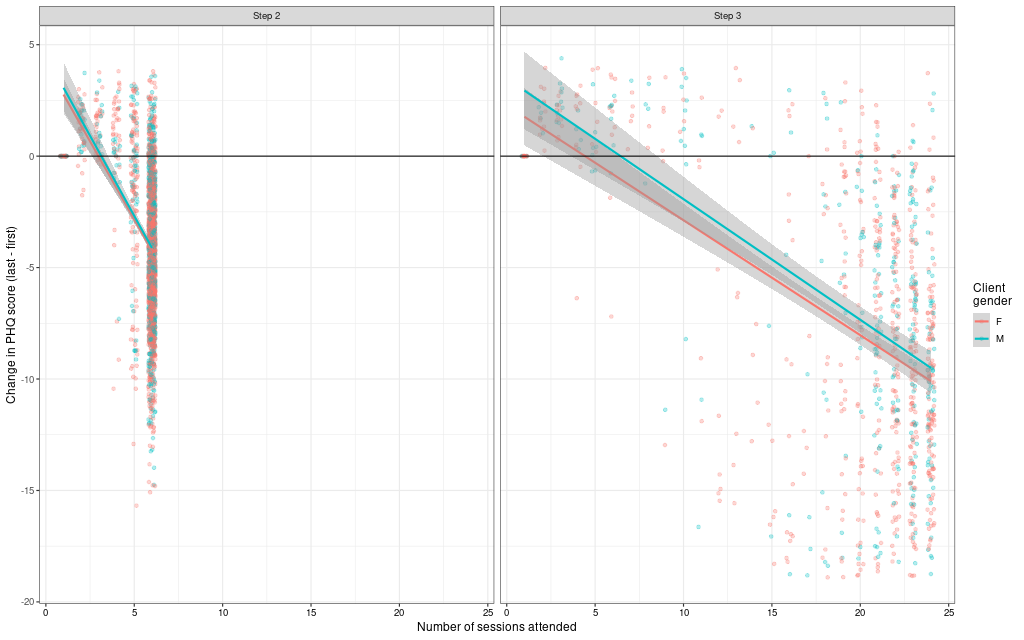
Figure 8.3 Notched boxplots of PHQ change by care step and opting-out
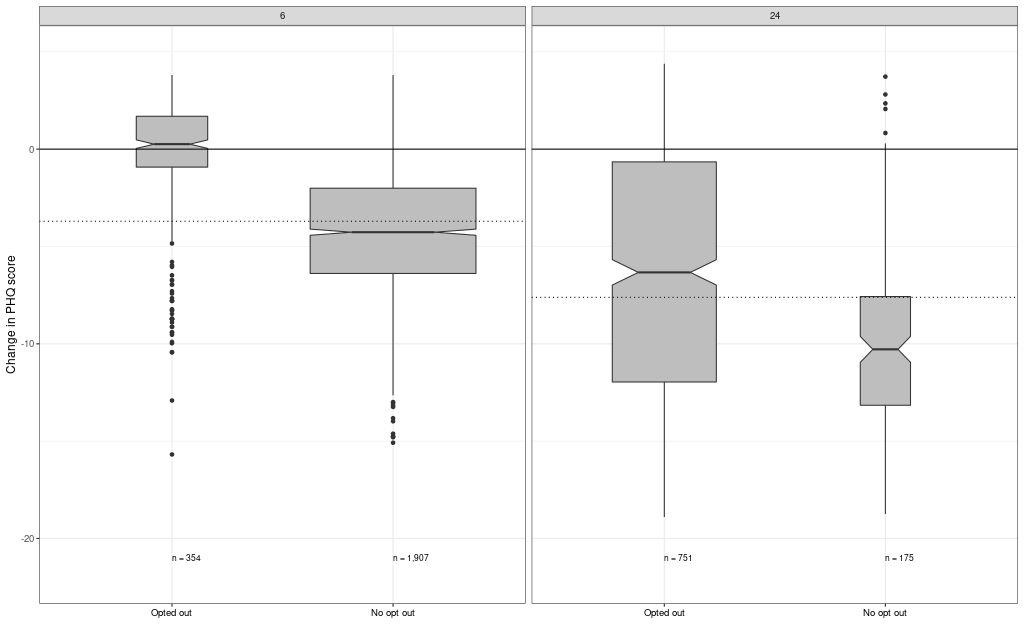
Figure 8.4 Notched boxplots of sessions attended by those opting out, by care step
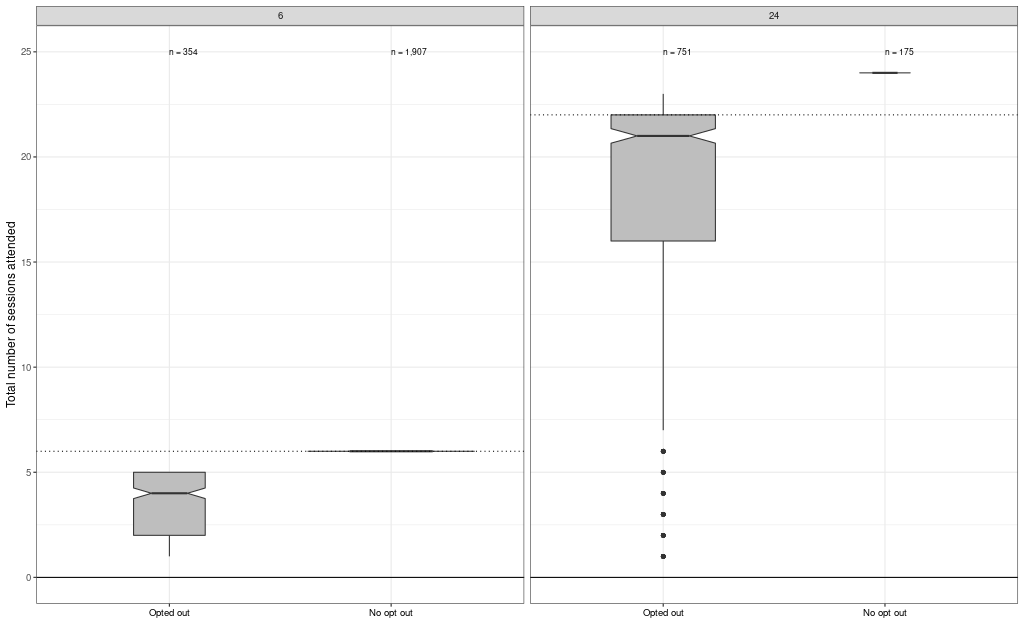
Figure 8.5 Stretched cat’s cradle plot showing early opt-out PHQ trajectories
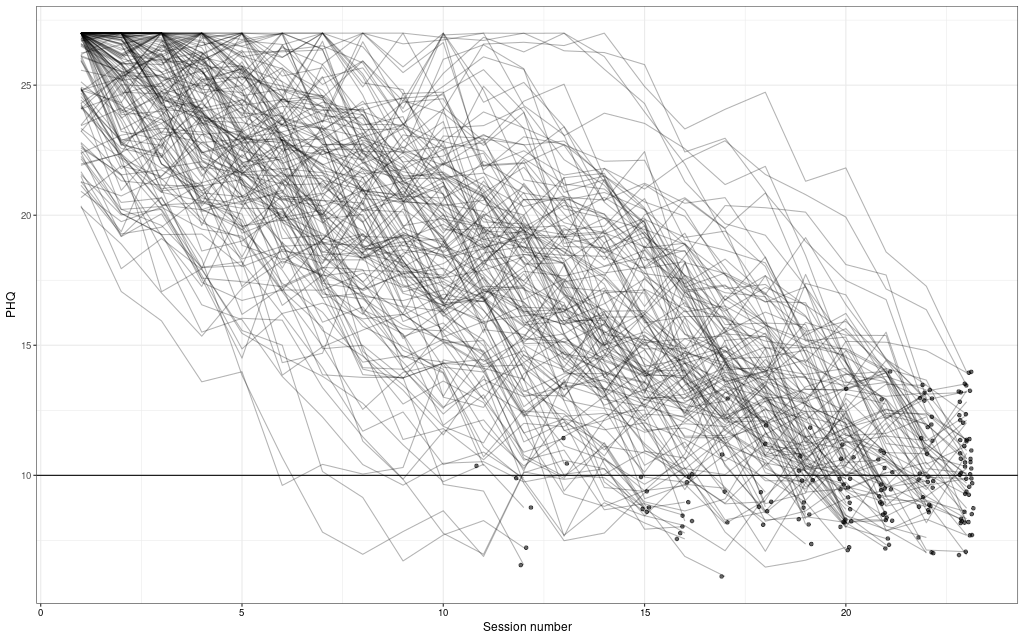
Figure 8.6 Forest plot of PHQ change against local deprivation index

Figure 8.7 Forest plot of PHQ change against therapist experience/training and care step
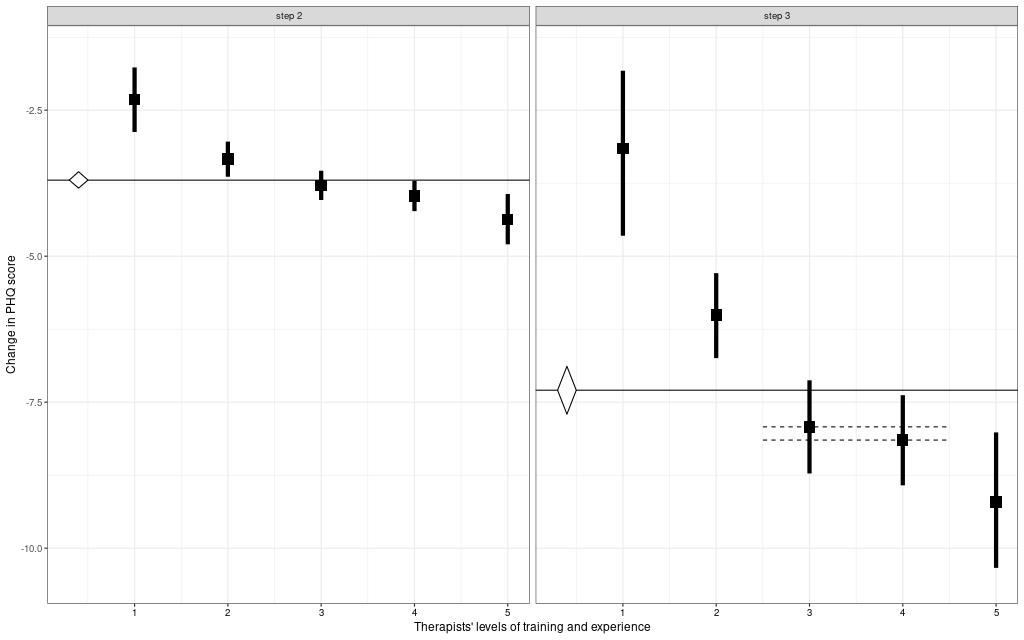
Figure 9.1 Anonymous cartoon: rating scale
Updated 13/11/21